From: Chapter 20, Using the Map Viewer to Explore Genomes

NCBI Bookshelf. A service of the National Library of Medicine, National Institutes of Health.

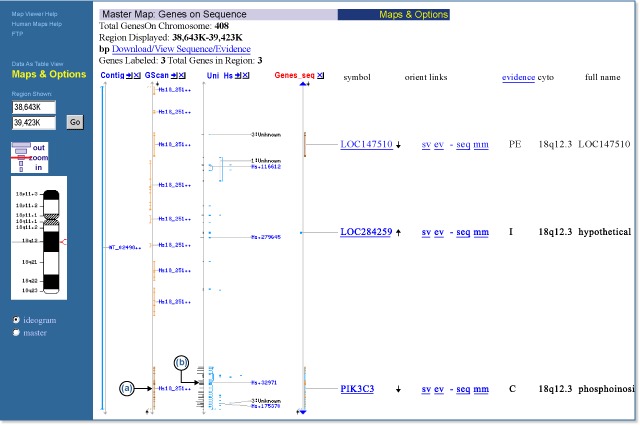
A comparison of cDNA alignments (UniGene, RNA) and gene predictions (GenomeScan) to the genomic contig annotation can be achieved by displaying three maps simultaneously. The genomic contig (NT_024981.9) annotation is shown in the Genes_seq map and is displayed with the GenomeScan predictions (the GScan map) and the EST/mRNA alignments labeled by human UniGene clusters (the UniG_Hs map). Note that in this case, there are two sequence objects not included in the contig annotation: one is an ab initio prediction (the last model in the GScan map) (a); and the other is either some small gene or an alternative 3′ exon for PIK3C3 from the UniG_Hs map (b). This approach is especially useful when reviewing BLAST results in a genomic context.
From: Chapter 20, Using the Map Viewer to Explore Genomes

NCBI Bookshelf. A service of the National Library of Medicine, National Institutes of Health.