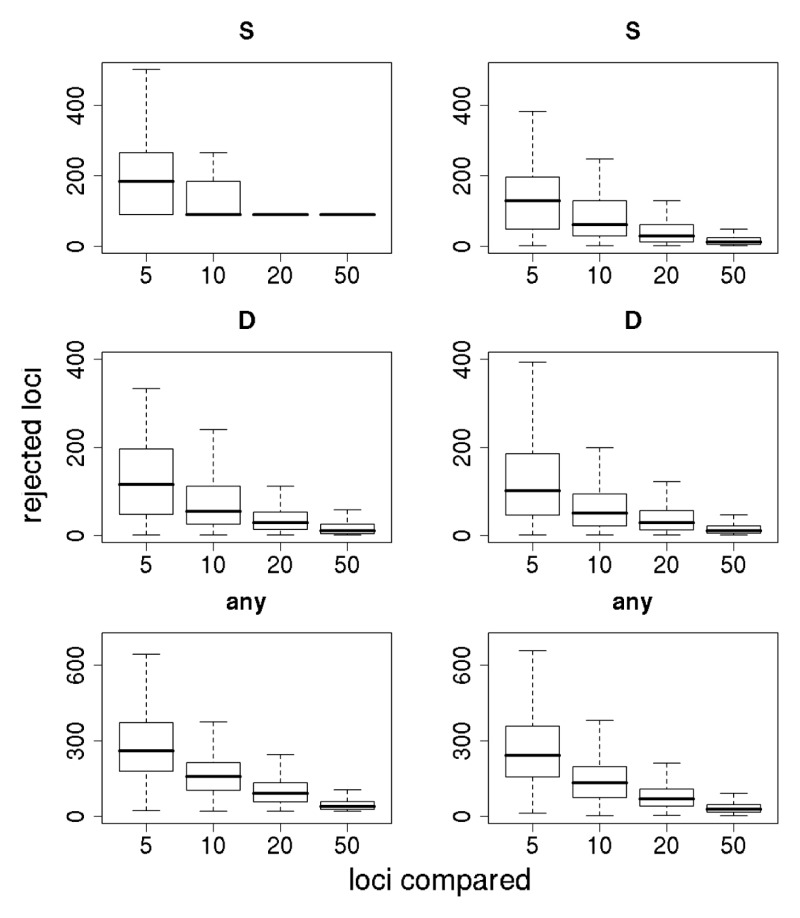
FIGURE 11.3. Resampling tests to examine empirical ranking methods for finding candidate genes.

FIGURE 11.3Resampling tests to examine empirical ranking methods for finding candidate genes

Left represents sequence data from maize alone; Right demonstrates the difference in statistics between maize and teosinte. The statistics are the number of SNPs (S) (Top), Tajima’s D (Middle), and a combination of both (Bottom) (see text). For each graph, the heavy line represents the median number of genes, of ≈800, that are inferred to be under selection. Boxes represent the central 50% of the data, and lines extend out to 3/2 of the interquantile range.

From: 11, Plant Domestication, a Unique Opportunity to Identify the Genetic Basis of Adaptation
Cover of In the Light of Evolution
In the Light of Evolution: Volume I: Adaptation and Complex Design.
National Academy of Sciences; Avise JC, Ayala FJ, editors.
Washington (DC): National Academies Press (US); 2007.
Copyright © 2007, National Academies of Sciences.

NCBI Bookshelf. A service of the National Library of Medicine, National Institutes of Health.