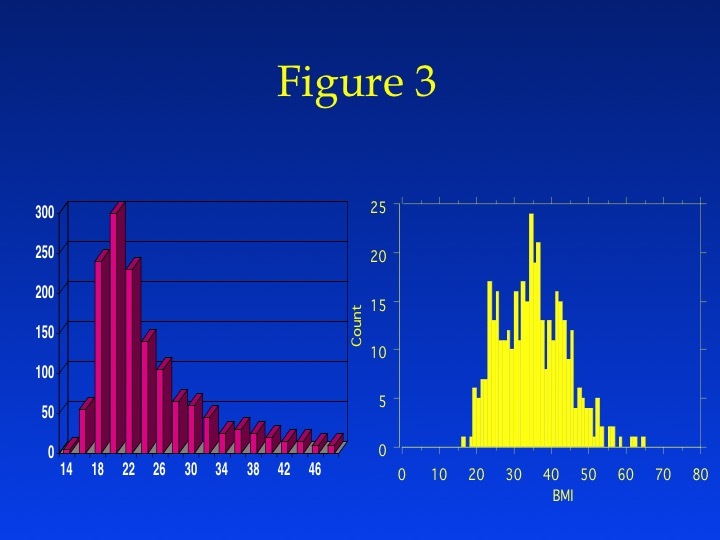
Figure 3: Distribution (counts on y axis) of BMI in women with PCOS from a large cohort of women diagnosed with PCOS in the United Kingdom ( N = 1741)(21) compared to that from a cohort in the United States ( N = 398) (Legro, unpublished data). Compare a mode of BMI of 20 for the UK women with a BMI of 35 for the U.S. women.

Figure 3

Distribution (counts on y axis) of BMI in women with PCOS from a large cohort of women diagnosed with PCOS in the United Kingdom ( N = 1741)(21) compared to that from a cohort in the United States ( N = 398) (Legro, unpublished data). Compare a mode of BMI of 20 for the UK women with a BMI of 35 for the U.S. women.

From: Evaluation and Treatment of Polycystic Ovary Syndrome

Cover of Endotext
Endotext [Internet].
Feingold KR, Anawalt B, Blackman MR, et al., editors.
South Dartmouth (MA): MDText.com, Inc.; 2000-.
Copyright © 2000-2024, MDText.com, Inc.

This electronic version has been made freely available under a Creative Commons (CC-BY-NC-ND) license. A copy of the license can be viewed at http://creativecommons.org/licenses/by-nc-nd/2.0/.

NCBI Bookshelf. A service of the National Library of Medicine, National Institutes of Health.