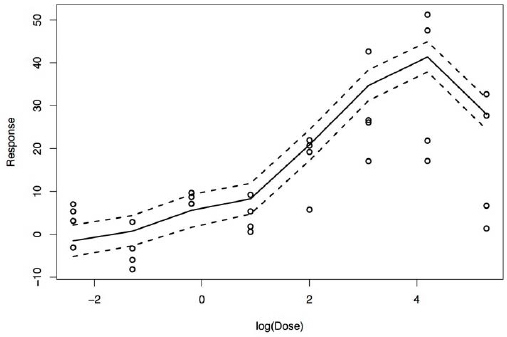
FIGURE E-2. Estimated dose–response curve (solid line) for PXR activation and 95% credible interval (dashed lines) for one chemical.

FIGURE E-2Estimated dose–response curve (solid line) for PXR activation and 95% credible interval (dashed lines) for one chemical

The credible interval is for the mean curve and so is not expected to enclose most of the data points (circles). The estimated dose–response curve is based on the full QSAR and PXR datasets for 969 chemicals in addition to the data points shown. Dose is presented as concentration (μM) and response as fold increase or decrease in transcription.

From: E, A Bayesian Example: Predicting Dose–Response Relationships from High-Throughput Data and Chemical Structure

Cover of Using 21st Century Science to Improve Risk-Related Evaluations
Using 21st Century Science to Improve Risk-Related Evaluations.
National Academies of Sciences, Engineering, and Medicine; Division on Earth and Life Studies; Board on Environmental Studies and Toxicology; Committee on Incorporating 21st Century Science into Risk-Based Evaluations.
Washington (DC): National Academies Press (US); 2017 Jan 5.
Copyright 2017 by the National Academy of Sciences. All rights reserved.

NCBI Bookshelf. A service of the National Library of Medicine, National Institutes of Health.