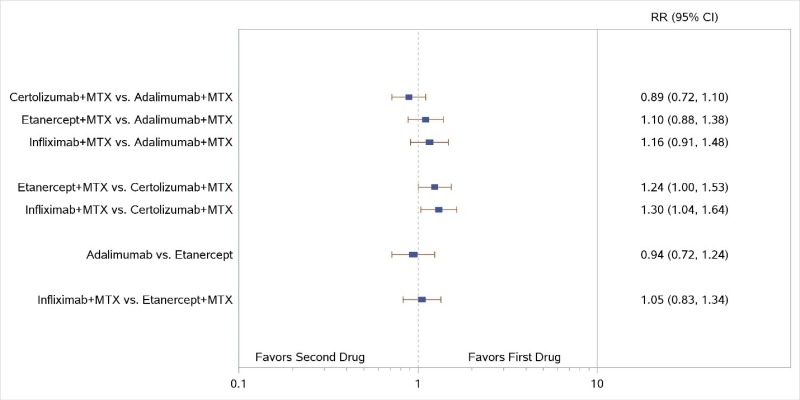
Figure 15 displays a forest plot for the network meta-analysis of studies reporting ACR50 response rates. Seven comparisons were used in this analysis. Study-level data used in this Figure are presented in Appendix C. This figure is described further in the KQ1 Results section “TNF Versus TNF” as follows: “NWMA of ACR50 response rates found no significant differences in comparisons with ADA plus MTX versus CZP plus MTX, ETN plus MTX, or IFX plus MTX. IFX plus MTX had higher ACR50 response rates than CZP plus MTX, but the confidence interval was large (RR, 1.30; 95% CI, 1.04 to 1.64)”.

Figure 15Forest plot for network meta-analysis of ACR50 response rates: TNF biologic versus TNF biologic

95% CI = 95% confidence interval; ACR50 = American College of Rheumatology 50% improvement; MTX = methotrexate; RR = relative risk; TNF = tumor necrosis factor; vs. = versus.

From: Results

Cover of Drug Therapy for Early Rheumatoid Arthritis: A Systematic Review Update
Drug Therapy for Early Rheumatoid Arthritis: A Systematic Review Update [Internet].
Comparative Effectiveness Review, No. 211.
Donahue KE, Gartlehner G, Schulman ER, et al.

NCBI Bookshelf. A service of the National Library of Medicine, National Institutes of Health.