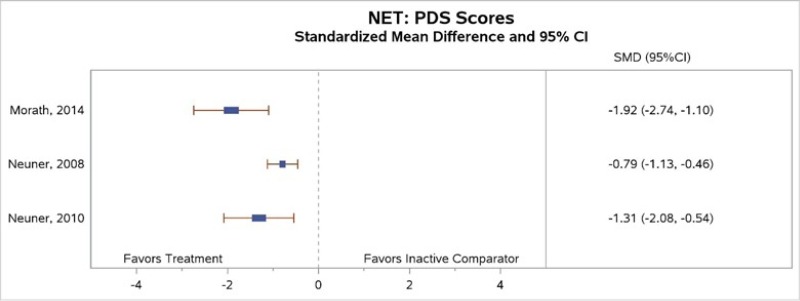
Figure 16 is titled “Standardized mean change from baseline to end of treatment in PTSD symptoms for narrative exposure therapy compared with inactive controls. The figure displays a forest plot reporting standardized mean difference in PTSD symptoms as measured by the PDS, narrative exposure therapy compared with inactive controls. This figure is described further in the “PTSD Symptoms” section as follows: “All three trials that compared NET with an inactive comparator found that NET subjects had greater decreases in PTSD symptoms at the end of treatment (moderate SOE; Figure 16). One trial reported a reduction (but no data) in PTSD symptoms for subjects in the intervention group at the follow-up assessment 6 months after the end of treatment; another reported that the intervention lead to significantly greater decreases in PTSD symptoms than no treatment (i.e., monitoring group) from baseline to the 6-month follow-up (d=1.4 and 0.08, respectively, p<0.001).”

Figure 16Standardized mean change from baseline to end of treatment in PTSD symptoms for narrative exposure therapy compared with inactive controls

CI = confidence interval; NET = narrative exposure therapy; PDS = Posttraumatic Diagnostic Scale; SMD = standardized mean difference.

From: Results

Cover of Psychological and Pharmacological Treatments for Adults With Posttraumatic Stress Disorder: A Systematic Review Update
Psychological and Pharmacological Treatments for Adults With Posttraumatic Stress Disorder: A Systematic Review Update [Internet].
Comparative Effectiveness Review, No. 207.
Forman-Hoffman V, Middleton JC, Feltner C, et al.

NCBI Bookshelf. A service of the National Library of Medicine, National Institutes of Health.