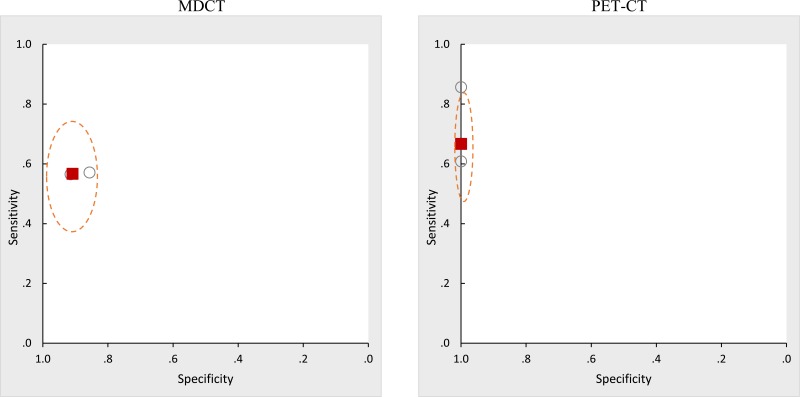
Figure 9 depicts the accuracy of MDCT versus PET-CT for the assessment of metastases in what is called “ROC space”, namely, sensitivity is shown along the y axis and 1-specificity is shown along the x-axis. The left plot shows the data for MDCT, and the right plot shows the data for PET-CT, and each study appears in both plots as an open circle. The filled square is the meta-analytic summary point after combining the study results, and the ellipse around it is the 95% confidence range for the summary point.

Figure 9ROC plot of metastases, MDCT versus PET-CT

The left side of the plot shows the multidetector computed tomography (MDCT) data in receiver operating characteristic (ROC) space; the right side shows the positron emission tomography–computed tomography (PET-CT) data in ROC space. Each study contributed one circle to each side of the plot. The filled square shows the summary estimate, and the dashed region shows the 95% confidence interval range around the summary estimate.

From: Results

Cover of Imaging Tests for the Diagnosis and Staging of Pancreatic Adenocarcinoma
Imaging Tests for the Diagnosis and Staging of Pancreatic Adenocarcinoma [Internet].
Comparative Effectiveness Review, No. 141.
Treadwell J, Mitchell M, Eatmon K, et al.

NCBI Bookshelf. A service of the National Library of Medicine, National Institutes of Health.