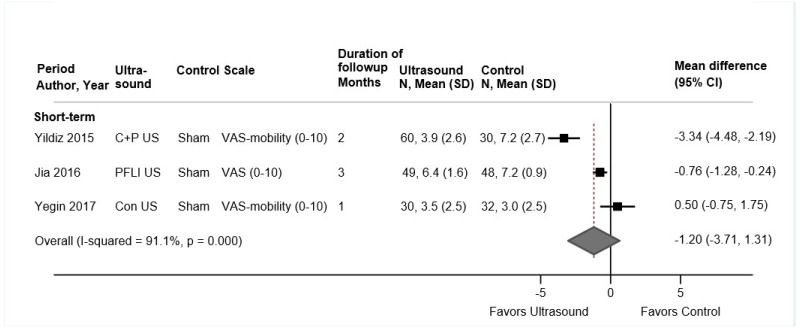
Figure 38 is a forest plot. Mean differences were reported or calculated for three short-term studies, with a pooled mean difference of −1.20 (95% confidence interval −3.71 to 1.31) and an overall I-squared value of 91.1%.

Figure 38Ultrasound versus sham for osteoarthritis knee pain: effects on pain

ADL = activities of daily living; CI = confidence interval; Con US = continuous ultrasound; C+P US = continuous and pulsed ultrasound combined; N = number; PFLI US = pulsed frequency low intensity ultrasound; SD = standard deviation; VAS = visual analog scale.

From: Results

Cover of Noninvasive Nonpharmacological Treatment for Chronic Pain: A Systematic Review Update
Noninvasive Nonpharmacological Treatment for Chronic Pain: A Systematic Review Update [Internet].
Comparative Effectiveness Review, No. 227.
Skelly AC, Chou R, Dettori JR, et al.

NCBI Bookshelf. A service of the National Library of Medicine, National Institutes of Health.