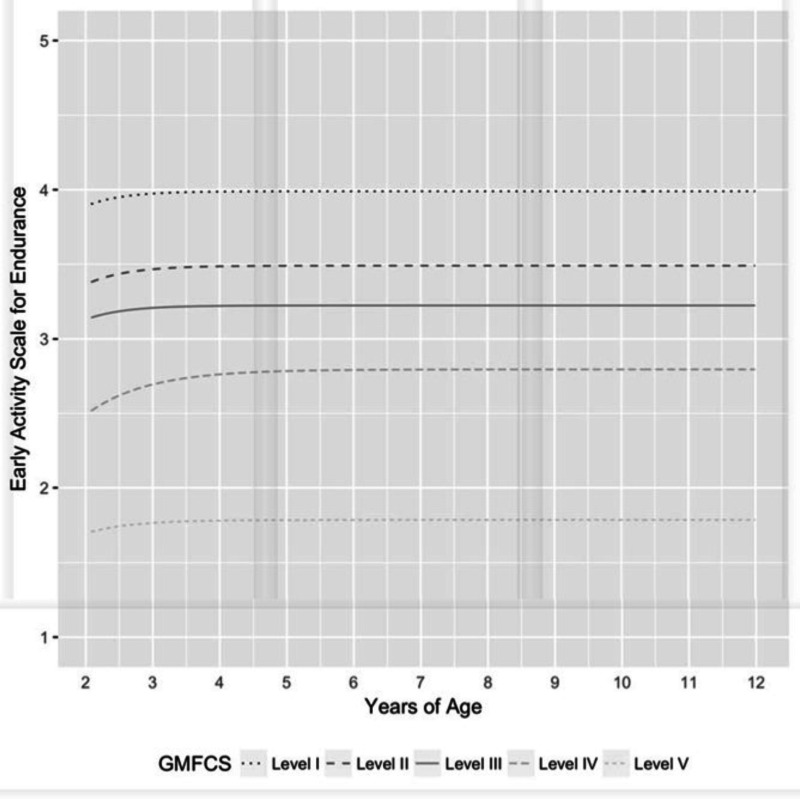
Figure 6. Longitudinal Curves for the Early Activity Scale for Endurance.

Figure 6Longitudinal Curves for the Early Activity Scale for Endurance

GMFCS Level I Mean (95% CI)GMFCS Level II Mean (95% CI)GMFCS Level III Mean (95% CI)GMFCS Level IV Mean (95% CI)GMFCS Level V Mean (95% CI)
2 y3.9 (3.6-4.0)3.3 (3.0-3.5)3.0 (2.6-3.3)2.5 (2.2-2.7)1.6 (1.3-1.8)
5 y4.0 (3.9-4.1)3.5 (3.4-3.6)3.2 (3.1-3.4)2.8 (2.7-2.9)1.8 (1.7-1.9)
12 y4.0 (3.9-4.1)3.5 (3.4-3.6)3.2 (3.1-3.4)2.8 (2.7-2.9)1.8 (1.7-1.9)
Change 2-5 y0.1 (0.0-0.3)0.2 (0.0-0.5)0.2 (0.0-0.6)0.3 (0.1-0.6)0.1 (0.0-0.4)
Change 5-12 y0.0 (0.0-0.0)0.0 (0.0-0.0)0.0 (0.0-0.0)0.0 (0.0-0.1)0.0 (0.0-0.1)

Abbreviation: GMFCS, Gross Motor Function Classification System.

From: Understanding the Development of Children with Cerebral Palsy and How Therapy May Affect Patient-Centered Outcomes

Cover of Understanding the Development of Children with Cerebral Palsy and How Therapy May Affect Patient-Centered Outcomes
Understanding the Development of Children with Cerebral Palsy and How Therapy May Affect Patient-Centered Outcomes [Internet].
McCoy SW, Bartlett D, Palisano R, et al.
Copyright © 2019. University of Washington. All Rights Reserved.

This book is distributed under the terms of the Creative Commons Attribution-NonCommercial-NoDerivs License which permits noncommercial use and distribution provided the original author(s) and source are credited. (See https://creativecommons.org/licenses/by-nc-nd/4.0/

NCBI Bookshelf. A service of the National Library of Medicine, National Institutes of Health.