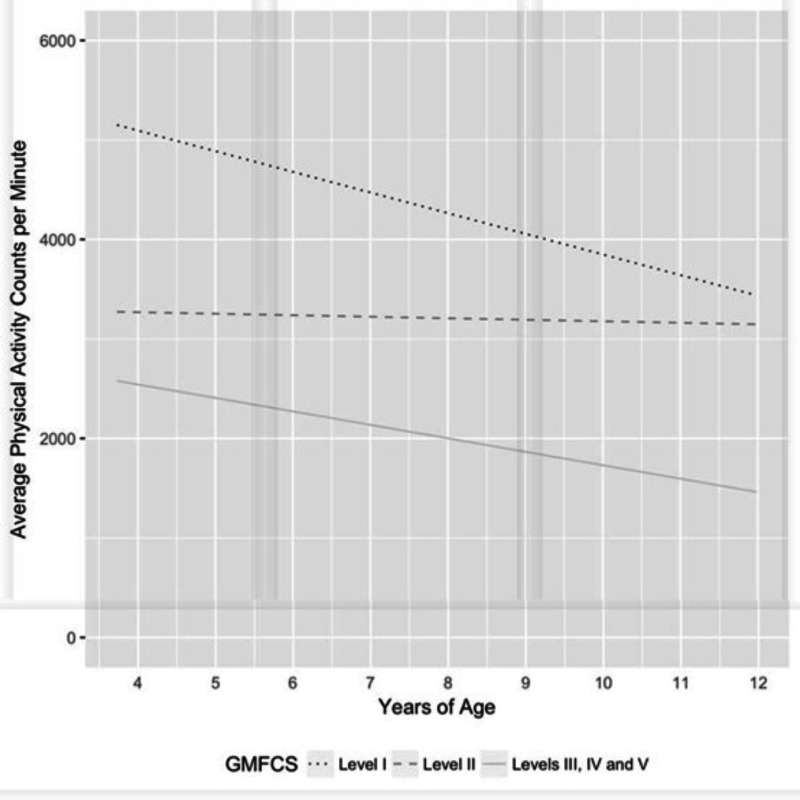
Figure 12. Longitudinal Curves for Average Physical Activity Counts Per Minute.

Figure 12Longitudinal Curves for Average Physical Activity Counts Per Minute

GMFCS Level I Mean (95% CI)GMFCS Level II Mean (95% CI)GMFCS l III, IV, and V Mean (95% CI)
2 y4890 (4447-5327)3259 (2791-3716)2409 (2095-2718)
5 y4268 (4058-4471)3214 (2922-3499)2004 (1789-2213)
12 y2815 (2025-3650)3109 (2502-3739)1059 (471-1665)
Change 2-5 y−623 (−957 to −267)−45 (−315 to 240)−405 (−631 to −164)
Change 5-12 y−1453 (−2233 to −624)−105 (−735 to 561)−945 (−1472 to −382)

Abbreviation: GMFCS, Gross Motor Function Classification System.

From: Understanding the Development of Children with Cerebral Palsy and How Therapy May Affect Patient-Centered Outcomes

Cover of Understanding the Development of Children with Cerebral Palsy and How Therapy May Affect Patient-Centered Outcomes
Understanding the Development of Children with Cerebral Palsy and How Therapy May Affect Patient-Centered Outcomes [Internet].
McCoy SW, Bartlett D, Palisano R, et al.
Copyright © 2019. University of Washington. All Rights Reserved.

This book is distributed under the terms of the Creative Commons Attribution-NonCommercial-NoDerivs License which permits noncommercial use and distribution provided the original author(s) and source are credited. (See https://creativecommons.org/licenses/by-nc-nd/4.0/

NCBI Bookshelf. A service of the National Library of Medicine, National Institutes of Health.