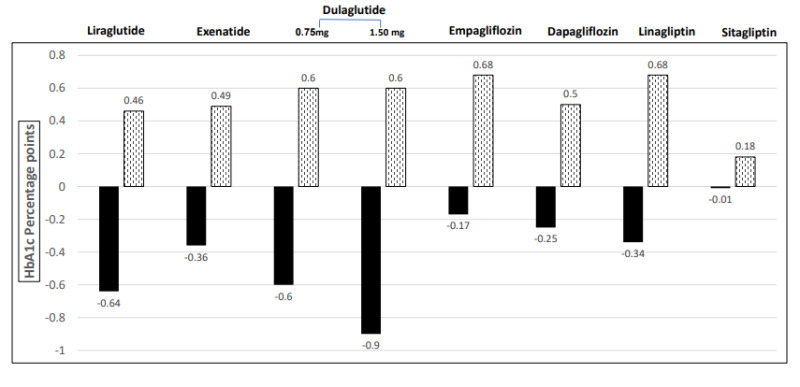
Figure 3. . Change in HbA1c percentage points in adolescents with T2D under medication treatment compared with untreated control group.

Figure 3.

Change in HbA1c percentage points in adolescents with T2D under medication treatment compared with untreated control group. The differences in HbA1c percentage points from the baseline for adolescents diagnosed with T2D who received medication treatment (depicted in black) compared to control groups (shown in white with data points). In the medication-treated group, there is a significant decrease in HbA1c levels, denoted by the downward trend in the black bars. Conversely, in the control groups of all the studies, HbA1c levels increased, as indicated by the upward trend in the white bars with data points.

From: Type 2 Diabetes in Children and Adolescents- A Focus on Diagnosis and Treatment

Cover of Endotext
Endotext [Internet].
Feingold KR, Anawalt B, Blackman MR, et al., editors.
South Dartmouth (MA): MDText.com, Inc.; 2000-.
Copyright © 2000-2024, MDText.com, Inc.

This electronic version has been made freely available under a Creative Commons (CC-BY-NC-ND) license. A copy of the license can be viewed at http://creativecommons.org/licenses/by-nc-nd/2.0/.

NCBI Bookshelf. A service of the National Library of Medicine, National Institutes of Health.