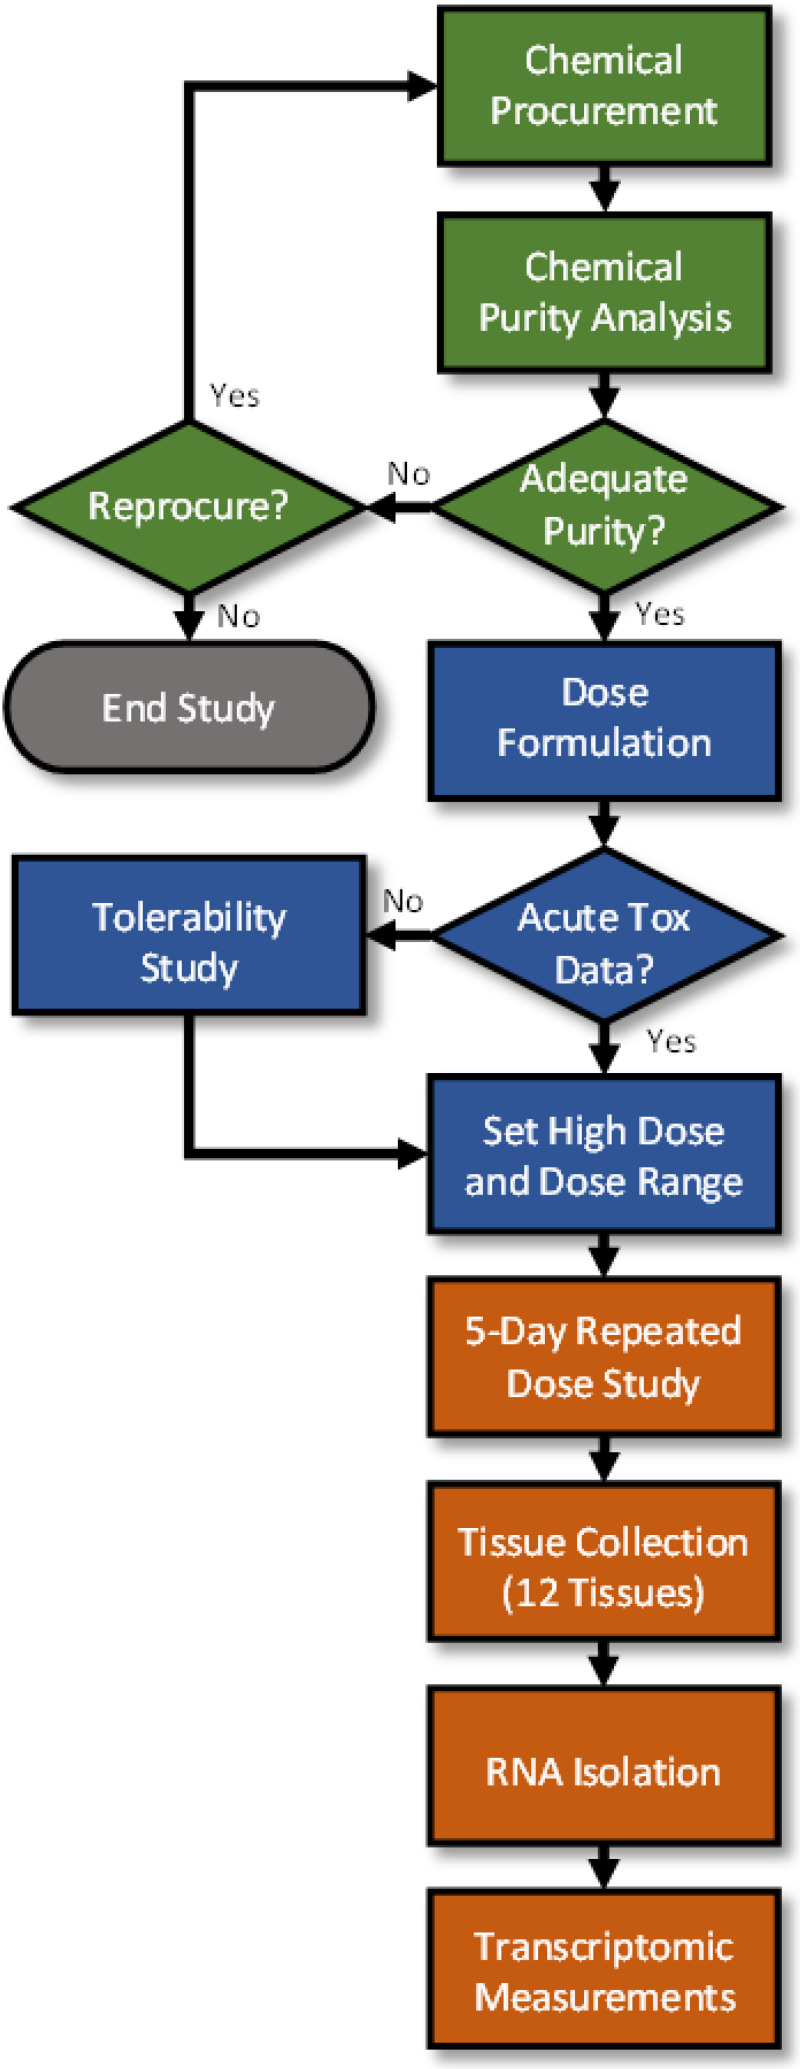
flow chart

Figure 3-1Flow chart depicting the main components and associated processes starting with chemical procurement and ending with the 5-day in vivo transcriptomic study

The green-colored processes and decision points are associated with the chemical procurement and analytical chemistry quality control evaluation. The blue-colored processes and decision point are associated with the dose formulation and dose setting. The orange-colored processes are associated with the 5-day in vivo repeated dose study, tissue collection, and transcriptomic measurements. The gray-color indicates a terminal node.

From: 3, METHODS

Cover of Standard Methods for Development of EPA Transcriptomic Assessment Products (ETAPs)
Standard Methods for Development of EPA Transcriptomic Assessment Products (ETAPs).
Auerbach S, Casey W, Chang D, et al.
Washington (DC): U.S. Environmental Protection Agency; 2024 Mar.

NCBI Bookshelf. A service of the National Library of Medicine, National Institutes of Health.