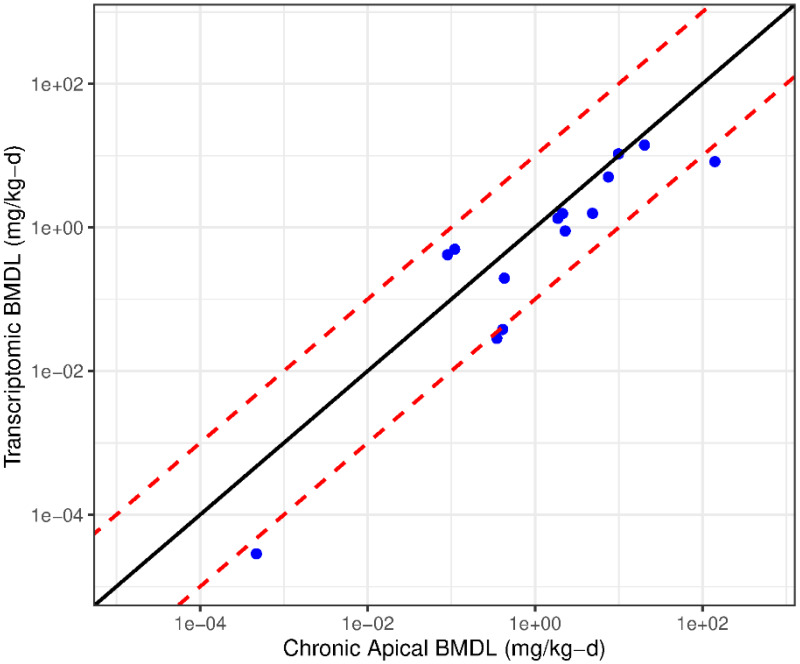
Figure 4-3. Scatter plot of log10 transcriptomic BMDL versus the minimum of the chronic non-cancer and cancer apical log10 BMDL values for the top ranked combination of pre-modeling probe filter, BMD modeling, and gene set summarization parameters (Table 4-3).

Figure 4-3Scatter plot of log10 transcriptomic BMDL versus the minimum of the chronic non-cancer and cancer apical log10 BMDL values for the top ranked combination of pre-modeling probe filter, BMD modeling, and gene set summarization parameters (Table 4-3)

The black line is 1:1 concordance. The red lines are ± 10-fold. Values below the black line indicate the transcriptomic BMDL value is less than the chronic apical BMDL value.

From: 4, DEVELOPMENT OF TRANSCRIPTOMIC POINTS OF DEPARTURE FOR ETAP

Cover of Scientific Studies Supporting Development of Transcriptomic Points of Departure for EPA Transcriptomic Assessment Products (ETAPs)
Scientific Studies Supporting Development of Transcriptomic Points of Departure for EPA Transcriptomic Assessment Products (ETAPs).
Auerbach S, Casey W, Chang D, et al.
Washington (DC): U.S. Environmental Protection Agency; 2024 Mar.

NCBI Bookshelf. A service of the National Library of Medicine, National Institutes of Health.