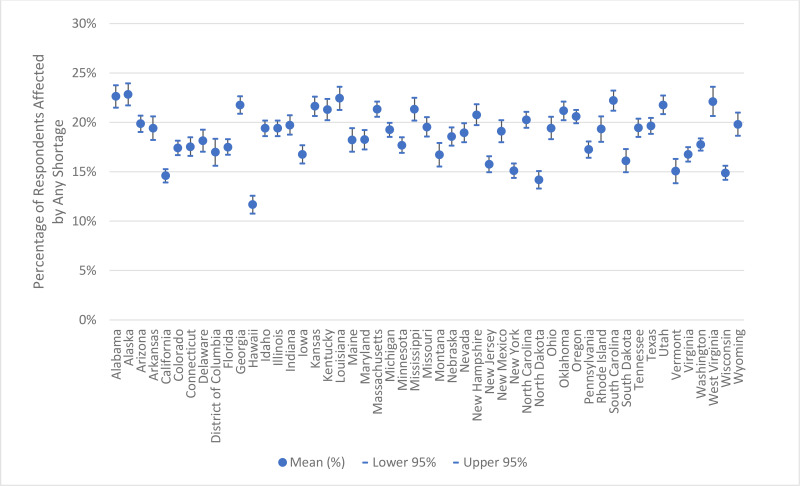
Appendix figure 2 is a chart showing the percentage of U.S. adults, by state and the District of Columbia, reporting being affected by medical product shortages. The percentage of impacted adults by state ranges from slightly more than ten percent to slightly less than twenty-five percent.

Appendix Figure 2Percentage of U.S. Adults Reporting Being Affected by Medical Product Shortages, by State and the District of Columbia

Notes: We define “any shortage” as a respondent who reported being impacted by at least one type of shortage (prescription, over-the-counter, device, other). In calculating “any shortage,” respondents experiencing multiple shortages are only counted once. The mean represents the average percentage of respondents experiencing any shortage within the last month across the three survey waves administered during August–October 2023 in each state.

Source: ASPE analysis of the Household Pulse Survey for August–October 2023.

From: Medical Product Shortages in the United States: Demographic and Geographic Factors and Impacts

Cover of Medical Product Shortages in the United States: Demographic and Geographic Factors and Impacts
Medical Product Shortages in the United States: Demographic and Geographic Factors and Impacts: Issue Brief [Internet].
Beleche T, Kolbe A.

NCBI Bookshelf. A service of the National Library of Medicine, National Institutes of Health.