

NCBI Bookshelf. A service of the National Library of Medicine, National Institutes of Health.
Ervin AM, Boland MV, Myrowitz EH, et al. Screening for Glaucoma: Comparative Effectiveness [Internet]. Rockville (MD): Agency for Healthcare Research and Quality (US); 2012 Apr. (Comparative Effectiveness Reviews, No. 59.)
This publication is provided for historical reference only and the information may be out of date.
Topic Development
AHRQ requested that the Johns Hopkins University Evidence Based Practice Center (JHU EPC) assist with the formulation and refinement of the Comparative Effectiveness Review (CER) topic, effectiveness of screening and treatment for glaucoma. In consultation with AHRQ, the JHU EPC investigators identified a small group of stakeholders to serve as members of a Key Informant Group. The Key Informant Group helped shape the Key Questions (KQs) relevant to the topic by providing input regarding the populations and clinical subgroups; interventions; and outcomes of interest to clinicians, policy makers, payers, and consumers.
The EPC investigators incorporated the feedback of the Key Informants into a draft of the KQs, analytic framework, and inclusion criteria. A draft of the KQs was posted on the AHRQ Web site for public comment from 22 April to 20 May 2010. The investigators finalized the inclusion criteria after considering these public comments.
A Technical Expert Panel (TEP) was selected to provide broad expertise and perspectives specific to the topic. The TEP reviewed the proposed methodological approach for completing the comparative effectiveness review and provided information to the EPC to aid in the refinement of the inclusion criteria and literature search strategies. The final protocol titled The Comparative Effectiveness of Screening for Open-Angle Glaucoma was posted to the AHRQ Web site on 16 November 2010.
Analytic Framework
The analytic framework (Figure 1) depicts the impact of both screening and treatment for OAG. It depicts the KQs within the context of the inclusion criteria described in the following sections. The figure depicts how screening-based programs (which may incorporate treatment when indicated) may reduce visual impairment (S: KQ1) and/or improve patient reported outcomes (S: KQ2), reduce intraocular pressure (S: KQ4) and possibly slow the progression of optic nerve damage and/or visual field loss (S: KQ5). The figure also incorporates the potential predictive value of screening-based programs to detect OAG and OAG suspects (S: KQ3). Finally, the potential for harms of screening (S: KQ6) are illustrated in the framework.
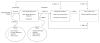
Figure 1
Analytic framework for screening and treatment for open-angle glaucoma. KQ = Key Question; T = Key questions for the Comparative Effectiveness of Treatment for Glaucoma; S = Key questions for the Comparative Effectiveness of Screening for Glaucoma
Study Selection
Types of Studies
We included randomized controlled trials, quasi-randomized controlled trials, and observational study designs, including cohort and case control studies, for KQs 1 through 6. For KQ3 we also included cross-sectional studies, study designs in which all tests (including the index, comparator, and reference standard) were performed on all participants, and designs in which participants were randomized to one test (among the index and potential comparator(s)) but all were evaluated with the reference standard.7 We excluded case series of fewer than 100 participants as studies smaller than this are expected to identify events occurring at a rate of less than 3 percent. We excluded conference abstracts that met our study inclusion criteria as we did not have the resources to contact the study investigators with additional queries before the conclusion of data abstraction. We also included systematic reviews that addressed the KQs.
We excluded studies that addressed the following:
- Prevalence of glaucoma in a specific population unless the studies also included tests of diagnostic accuracy
- Disease progression that did not include participants previously screened for glaucoma
- Risk factors for glaucoma
Types of Participants
We included studies of adult (as defined by included studies) asymptomatic participants in general or high-risk populations. For both populations we excluded studies of participants previously tested, diagnosed with glaucoma, or presenting with symptoms known to be related to a diagnosis of glaucoma. Asymptomatic high-risk populations included those with a family history of glaucoma; those from specific racial/ethnic groups; those with specific ocular or other medical conditions, as defined by included studies (e.g., diabetes); and older age groups, as defined by included studies.
We also included studies of suspected OAG subpopulations, which included participants identified from prior testing as possibly having glaucoma or as having a risk factor for glaucoma, e.g., high intraocular pressure, but with an unconfirmed diagnosis. We excluded studies of participants with known glaucoma at the time of screening (KQs 1, 2, 4 and 5) and those that included the healthy eye of a participant with known glaucoma (KQ 3). We excluded studies in which the candidate tests were performed on a sample of healthy volunteers only. We did not exclude studies that enrolled healthy volunteers in addition to those with suspected glaucoma at the time of screening.
Interventions
We included studies of the following screening tests conducted alone or in any possible combination (including multicomponent simultaneous or sequential testing):
- Direct and indirect ophthalmoscopy
- Fundus photography or computerized imaging of the posterior pole, optic disc or retinal nerve (optical coherence tomography (OCT; with the exception of OCT 1 and OCT 2), retinal tomography, scanning laser polarimetry)
- Pachymetry (corneal thickness measurement) when used in conjunction with another test to diagnose glaucoma (We excluded studies where pachymetry was used alone.)
- Perimetry (including short-wavelength, high-pass, motion, flicker perimetry, yellow and blue perimetry)
- Tonometry (contact and non-contact tonometry)
We excluded studies of the following screening tests and related analysis software that are either not commercially available for screening or are not commonly or no longer used in the diagnosis of glaucoma:
- Contrast sensitivity and visual acuity
- Electroretinography
- Heidelberg Retina Tomograph (HRT) 1 (confocal scanning laser ophthalmoscope)
- Optical coherence tomography (OCT) 1 and OCT 2
- Tests of color vision
- Versions of the GDx,(scanning laser polarimeter) without corneal compensation
- Water drinking tests
We also excluded studies that examined only technical aspects of included devices, e.g., usability, technician training.
Screening and Diagnostic Device Descriptions
Below are detailed descriptions of the devices and tests included in this comparative effectiveness review including mechanism, operation, and skill required to complete and interpret each test.
Tests of Optic Nerve Structure
Heidelberg Retinal Tomography (HRT)
The Heidelberg Retina Tomograph (HRT) is a scanning laser ophthalmoscope that can create three-dimensional images of the retina and optic nerve head. After the images are collected, the device analyzes them to calculate values such as the area of the optic nerve head, the area and volume of the neuro-retinal rim, the ratio of the area of the optic nerve head “cup” to the disc, and many others. The current versions of the device also compare values obtained for a particular patient to those of a population of healthy persons to estimate the probability of optic nerve disease consistent with glaucoma. Reports of these data can then be used by clinicians to diagnose either new or progressive disease.
The device itself consists of a table-mounted unit with imaging optics and a connected computer to allow for image acquisition, and management of patient data. As such, the system is not easily portable from place to place. Operation of the device also requires personnel who have been trained to operate the software and hardware. This training includes not only the basics of entering patient information but also trouble-shooting problems with image quality and patient positioning.
Optical Coherence Tomography (OCT)
An optical interferometer is used to create cross-sectional images of ocular structures including the retina and optic nerve head. Once the images are collected, they can be analyzed and various anatomic layers can be segmented for further analysis. Such analysis of the retinal nerve fiber layer and structure of the optic nerve head are most relevant to the diagnosis of glaucoma.
The original OCT devices all utilized time-domain analysis of the collected data. Thus, the time to collect an image was a significant limitation to the resolution that could be achieved. More recently, spectral domain devices have become available; they can collect higher resolution images in the same time required to collect lower resolution images using the time domain devices.
As with the HRT, the OCT machines all consist of a table-mounted unit with the optics connected to a computer for image acquisition and analysis. There are more portable versions of the optics available but they still require a connection to computational power for image analysis. OCT devices also require trained personnel to operate them effectively.
Optic Disc Photography
After hand drawing, photographs are perhaps the earliest method of documenting the appearance of the optic nerve head. Photographs can be taken as single images, nonsimultaneous stereo pairs in which the camera is moved slightly between images and simultaneous stereo pairs in which two images are captured simultaneously. The advantage of stereo photographs is that they enhance the reviewer’s ability to assess optic nerve structures. Although optic disc photographs were first captured on film, they now are captured using digital technology. Historically, obtaining good quality photographs required a trained ophthalmic photographer and an expensive camera system. As the systems have become more computerized and the optics more refined, the skill required to acquire adequate images has declined to the point where some telemedicine systems no longer require specially trained operators.
The analysis of optic nerve photographs is currently less quantitative than the imaging techniques above. Although computerized analysis of digital images is improving, as such, good quality evaluation of disc photographs requires significant skill on the part of the examiner.
Retinal Nerve Fiber Layer (RNFL) Photography
A specialized photographic technique using red-free (green) light to image the retinal nerve fiber layer. Green light is absorbed by the melanin in the retinal nerve fiber (RNFL) and the striations become visible as they radiate around the optic nerve. RNFL photographs permit comparisons over time and can help detect diffuse or localized RNFL loss consistent with glaucoma. RNFL photographs are difficult and often uncomfortable for the patient and require specialized equipment and trained photographers. For these reasons and because they are difficult for clinicians to interpret, they rarely are used in clinical practice.
Scanning Laser Polarimetry (SLP)
The scanning laser polarimeter assesses the retinal nerve fiber layer (RNFL) using polarized light to measure the phase shift that occurs due to the presence of repetitive micro-structures. The size of the shift depends on both the thickness and integrity of the RNFL. Because the cornea also contains repeating structures that affect polarized light, the commercial version of the scanning laser polarimeter has undergone multiple revisions to accommodate this effect. The images collected by SLP can be analyzed to assess the thickness of the RNFL, which is directly related to glaucomatous damage.
The company that manufacturers the commercially available SLP (GDx, Carl Zeiss Meditec) has designed the device as a single table-top unit that does not require a separate computer unlike the OCT and HRT. As with other available devices, however, training is required to obtain usable images reliably.
Tests of Optic Nerve Function
Frequency Doubling Technology (FDT)
Frequency doubling technology uses a perimeter that takes advantage of an alternative visual stimulus to assess the visual field. It presents flickering stimuli of varying contrast in various locations. The FDT perimeter was the first instrument using this technology. It is small, portable and can be administered in a screening mode in 45 to 90 seconds. The more recent instrument using this technology is the Humphrey Matrix, which uses smaller targets and has increased the number of locations tested in the visual field. The FDT is smaller than the Humphrey Matrix but both are relatively portable and technicians can be trained quickly to operate these instruments.
Goldmann Applanation Tonometry
Tonometry is the measurement of intraocular pressure (IOP). Applanation tonometry indirectly assesses the IOP by measuring the pressure required to flatten a certain area of the cornea. The Goldmann applanation tonometer uses a standard probe and is the current standard method to measure IOP. The cornea must be anesthetized with an eyedrop. The instrument is mounted on a biomicroscope. Most biomicroscopes are not portable and skilled training is needed for a technician or clinician to perform tonometry.
Noncontact Tonometry
Noncontact tonometry, also called air-puff tonometry, uses a rapid pulse of air to flatten the cornea. The IOP is estimated by an electro-optical system based on the time needed for the jet of air to flatten the cornea. It takes less time to flatten a soft eye (low IOP) than a hard eye (high IOP). The eye does not need to be anesthetized. Although the pulse is very rapid, patients frequently are startled by this test. Training to operate the instrument is easy and the table-mounted instrument can be transported when necessary.
Standard Automated Perimetry (SAP)
A perimeter can measure in a systematic way the visual field of an eye by presenting light stimuli of varying intensity at various locations. From the point of fixation both the width and sensitivity of the visual field can reveal defects typical of glaucoma optic nerve damage. By varying the size and brightness of the light target at multiple locations and asking the subject to respond if the image is seen the resultant score is a critical tool in both the diagnosis and monitoring of the progression of glaucoma. Standard automated perimetry (SAP) uses a white light stimulus on a white background to determine threshold values. Two instruments in wide use are the Humphrey field analyzer (HFA) and the Octopus. An alternative method of assessing the visual field is short-wavelength automated perimetry (SWAP), which uses a blue stimulus on a yellow background and is thought to be more sensitive for detecting early glaucoma. These instruments are all automated and administered by a technician after a short training time. Because they are subjective, perimetry can be fatiguing for the patient to perform. Furthermore, all devices are large enough to require a tabletop, though some are small enough to be reasonably portable.
Comparators/Reference Standards
KQs 1, 2, 4, 5, and 6 explore comparisons of the interventions mentioned above conducted alone or in any possible combination as a part of a screening-based program to no screening program (including usual care, case finding, and referral) and to different screening-based programs (above tests conducted alone or in any possible combination). KQ3 explores comparisons of screening/diagnostic tests to the reference standards of confirmed OAG at the time of followup or OAG requiring treatment (diagnosed by an ophthalmologist using objective assessments). The diagnosis should have included a clinical examination with measurement of intraocular pressure, assessment of the visual field and assessment of the optic nerve head and/or retinal nerve fiber layer, or review of disc photographs. We considered other methods to confirm diagnosis as defined by included studies whenever the examinations/tests were specified in the report. We acknowledge that there is no consensus on the gold standard test or combination of tests for the identification of patients with OAG. We adapted the reference standards for KQ3 from a diagnostic test accuracy review conducted by Burr (2007).7
Outcomes
KQ1
Primary Outcome
We identified studies that reported the proportion of participants with moderate, severe, and profound visual impairment as defined in the International Classification of Diseases, Clinical Modification, 9th Revision (Appendix D).8 We also considered other measurements of visual impairment as defined by included studies.
Secondary Outcome
We also considered visual acuity outcomes (e.g., mean visual acuity or proportion of participants in pre-specified visual acuity categories) reported in the included studies and as measured with Snellen, or any other valid chart that yields scores that can be converted to Snellen fractions or logarithm of the minimum angle of resolution (logMAR) values.
KQ2
We identified studies that reported the participants’ mean total or relevant item/subscale scores as measured by any validated questionnaire, e.g., National Eye Institute Visual Function Questionnaire, to compare the following patient-reported outcomes among the treatment groups of interest:
- Vision-related quality of life (vision-related functional decrement, compared to individuals without eye or vision problems, as well as the impact of functional loss on activities of daily living) (primary outcome)
- Patient satisfaction (secondary outcome)
KQ3
We extracted the number of participants in the following categories: true positives, true negatives, false positives, and false negatives in order to calculate sensitivity and specificity. We also included studies that reported sensitivity, specificity, or area under the ROC curve (AUC).
KQ4
We extracted the mean intraocular pressure to analyze the differences between/among the groups of interest.
KQ5
We compared the proportion of participants with progressive optic nerve damage as defined by included studies and as observed via fundus photography or other imaging of the posterior pole and the proportion of participants with progression of visual field loss as defined by included studies.
KQ6
We recorded the proportion of participants experiencing the following adverse events (adapted from the U.S. Preventive Services Task Force, http://www.ahrq.gov/clinic/uspstf05/glaucoma/glaucrs.htm) for each group of interest:
- Corneal abrasions
- Distortion of sense of taste (due to anesthetic use)
- Examination apprehension
- Eye irritation
- Harms related to over diagnosis
- Infection
- Psychological effects related to a glaucoma diagnosis or misdiagnosis
We also planned to report other harms as reported in included studies. We note that different screening and followup methods may result in different harms.
Timing of Outcome
We assessed outcomes for KQs 1, 2, 4, and 5 at 1 year of followup and at annual intervals thereafter. There was no minimum length of followup for outcomes related to KQs 3 and 6.
Setting
Settings for this review included community screenings, non-eye care health provider settings, eye care provider clinical settings (ophthalmologists and optometrists), and telemedicine.
Search Strategy
We searched the following databases for primary studies: MEDLINE®, Embase, LILACS (Latin American and Caribbean Literature on Health Sciences), and CENTRAL (the Cochrane Central Register of Controlled Trials). We developed a search strategy for MEDLINE, accessed via PubMed, based on an analysis of the medical subject headings, (MeSH) terms, and text words of key articles identified a priori. We adapted this search strategy for searches of Embase (using EMTREE terms), CENTRAL, and LILACS (Appendix A). We searched the literature without imposed language, sample size or date restrictions. We searched relevant systematic reviews to identify any additional studies that should be included. We searched from the beginning of each database through 6 October 2011.
We also conducted a search in MEDLINE and CENTRAL for systematic reviews that addressed the key questions of interest. The search included the topic strategy as noted in the Appendix combined with the term “AND systematic[sb]” and was limited to systematic reviews published from 2009 to 2011. We searched MEDION (www.mediondatabase.nl) for related diagnostic accuracy reviews (KQ3). The search for systematic reviews was conducted on 2 March 2011.
We screened an existing database of eye and vision systematic reviews prepared by Li (2010) to identify relevant OAG systematic reviews published prior to 2009.9 Li (2010) searched MEDLINE, Embase, and CENTRAL from inception to September 2009 and two reviewers screened titles, abstracts, and full text manuscripts to identify eye and vision systematic reviews.
Abstract Screening
We developed an abstract screening form. All investigators pilot tested the form using a set of candidate abstracts identified from the electronic searches. We screened potentially relevant citations (primary studies and systematic reviews) via the Web-based systematic review software DistillerSR (http://systematic-review.net/). All citations identified by the search strategies were uploaded to DistillerSR. Two reviewers independently assessed titles and abstracts resulting from the literature searches according to the inclusion criteria. We classified the titles and abstracts as “include,” “exclude,” or “unsure.” We resolved disagreements about eligibility through discussion among reviewers. For non-English language articles, we initially reviewed for inclusion articles with English abstracts, but decided to exclude all non-English articles as we were unable to identify appropriate translation services for all non-English abstracts and/or the full text of potentially eligible articles prior to the start of full text screening. A copy of the abstract screening form is included in Appendix B.
Full-Text Screening
Two reviewers independently applied the same inclusion criteria as used during abstract screening. Citations tagged as “unsure” by both reviewers, “unsure” by one reviewer and “include” by the other, or “include” by both reviewers, were promoted to full-text screening. We excluded non-English language articles from further consideration at this stage. We resolved any disagreements regarding inclusion through discussion between reviewers, or, as needed, among all investigators during a team meeting. A copy of the full-text screening form is included in Appendix B.
Data Abstraction
Data abstraction forms were designed and pilot tested. One reviewer extracted descriptions of the study, including details about the population, devices/tests and outcomes of interest, using the systematic review software DistillerSR. A second reviewer verified the data. We resolved disagreements through discussion. A copy of the data abstraction forms is included in Appendix B.
Risk of Bias Assessment
We used the Cochrane Collaboration’s tool for assessing the risk of bias of randomized and quasi-randomized trials. Two reviewers assessed the included studies for sources of systematic bias according to the guidelines in Chapter 8 of the Cochrane Handbook for Systematic Reviews of Interventions and evaluated the studies for the following criteria: sequence generation and allocation concealment (selection bias), masking of participants, study investigators, and outcome assessors (detection bias), incomplete outcome data (attrition bias), selective outcome reporting (reporting bias), and other sources of bias.10 Masking of investigators and participants may not have been possible with some of the tests being examined, but was noted when mentioned. We reported judgments for each criterion as “Low risk of bias,” “High risk of bias,” or “Unclear risk of bias (information is insufficient to assess).” The two reviewers resolved disagreements through discussion.
Two reviewers assessed the methodological rigor of observational studies using a modified version of the Newcastle Ottawa Scale.11 The Newcastle Ottawa Scale includes domains to assess the quality of study group selection (representativeness, selection, case definitions); comparability of cohorts/cases and controls on the basis of the design or analysis; and ascertainment of exposure(s) or outcome(s), adequacy of followup, non-response rate and financial or other conflicts of interest. Each item query required a yes, no, or unable to determine/not reported response.
For KQ3, we used the Quality Assessment of Diagnostic Accuracy Studies (QUADAS) checklist, which is a specific risk of bias assessment for diagnostic accuracy studies.12 The QUADAS tool includes 14 items that evaluate numerous domains including representativeness, inclusion/exclusion criteria, choice of reference standard, masked interpretation of results of tests and reference standard, and study withdrawal. We reported judgments for each checklist item as “Yes,” “No,” or “Unclear.”
We used a tool adapted by Li (2010) from the Critical Appraisal Skills Program, Assessment of Multiple Systematic Reviews, and the Preferred Reporting Items for Systematic Reviews and Meta-analyses statement to assess the methodological quality of systematic reviews.9 We used the following criteria, adapted from Li, to determine which were of sufficient quality to be considered for inclusion in this review: comprehensive search for primary studies (searches of more than one bibliographic database); inclusion of a risk of bias assessment of primary studies; and conduct of appropriate analytic methods for meta-analyses (no pooled arm analysis).
Rating of Evidence
We assessed the quantity, quality and consistency of the body of available evidence addressing KQ1 through KQ6. We used an evidence grading scheme recommended by the Grading of Recommendation Assessment, Development and Evaluation (GRADE) Working Group, adapted by AHRQ in the Methods Guide for Effectiveness and Comparative Effectiveness Reviews (http://www.effectivehealthcare.ahrq.gov/index.cfm/search-for-guides-reviews-and-reports/?pageaction=displayproduct&productid=328) and recently published in the Journal of Clinical Epidemiology.13,14
We considered the strength of the study designs with randomized controlled trials as the highest level of evidence, followed by comparative observational studies. Whenever an outcome was evaluated by at least one randomized controlled trial, and possibly observational studies, we graded the randomized controlled trial(s) and also the quality of the observational studies. If an outcome was evaluated by one or no randomized controlled trials, our evidence grade was based on the single randomized controlled trial in addition to the best available observational study.
We assessed the quality and consistency of the best available evidence, including assessments of the risk of bias in relevant studies, as well as aspects of consistency, directness, and precision as described in the Methods Guide for Effectiveness and Comparative Effectiveness Reviews and by Owens (2010).14 The GRADE approach, upon which the Methods Guide Strength of Evidence grading is based, is meta-analytic centric and so we adapted the guidance for some of the domains. For instance, in GRADE, “precision” is defined in terms of summary estimates. Since we did not complete meta-analyses, we based this judgment on reviewing the precision (width of confidence intervals, other measures of variability) across the included studies. For each outcome of interest, two reviewers graded the major outcomes for each KQ, and then the entire team discussed their recommendations and reached consensus.
Data Synthesis
When we identified existing high-quality systematic reviews that addressed the KQs, we cited these reviews as evidence and did not abstract and synthesize data from the primary studies. For interventions (screening and diagnostic tests), comparisons, and outcomes that were not covered in systematic reviews and to update systematic reviews, we abstracted evidence from primary studies, including those that had been published or identified after the date of last search conducted for the systematic review. We followed the recommendations of Whitlock (2008) for incorporating systematic reviews in complex reviews and provided a narrative summary of the review methods (i.e., inclusion/exclusion criteria, search strategy, statistical methodology) and findings (i.e., number of studies included, quantitative and qualitative results). Similarly, in the instance of multiple reviews, we evaluated the consistency across reviews addressing the same key question.15
- Methods - Screening for Glaucoma: Comparative EffectivenessMethods - Screening for Glaucoma: Comparative Effectiveness
Your browsing activity is empty.
Activity recording is turned off.
See more...