

NCBI Bookshelf. A service of the National Library of Medicine, National Institutes of Health.
Balk E, Adam GP, Kimmel H, et al. Nonsurgical Treatments for Urinary Incontinence in Women: A Systematic Review Update [Internet]. Rockville (MD): Agency for Healthcare Research and Quality (US); 2018 Aug. (Comparative Effectiveness Review, No. 212.)
Nonsurgical Treatments for Urinary Incontinence in Women: A Systematic Review Update [Internet].
Show details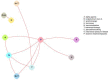
Figure H-1
Evidence graphs for cure in studies of stress and urgency urinary incontinence.
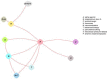
Figure H-2
Evidence graphs for improvement in studies of stress and urgency urinary incontinence.
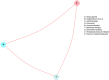
Figure H-3
Evidence graphs for satisfaction in studies of stress and urgency urinary incontinence.

Figure H-4
Evidence graphs for cure in studies of older women

Figure H-5
Evidence graphs for improvement in studies of older women

Figure H-6
Evidence graphs for satisfacton in studies of older women
Table H-1AOdds ratios for cure between all intervention categories: stress UI (subgraph 1)
| A | A | 0.11 (0.01, 0.84)‡ | 0.35 (0.12, 1) | 0.47 (0.09, 2.4) | 0.22 (0.06, 0.74)‡ | 0.92 (0.21, 4.05) | 0.45 (0.07, 2.88) | 1.22 (0.47, 3.18) |
|---|---|---|---|---|---|---|---|---|
| H+T | 9.36 (1.19, 73.64)‡ | H+T | 3.27 (0.48, 22.15) | 4.42 (0.45, 43.02) | 2.03 (0.36, 11.4) | 8.66 (0.97, 76.99) | 4.25 (0.37, 49.28) | 11.42 (1.72, 75.57)‡ |
| N | 2.86 (1, 8.16)‡ | 0.31 (0.05, 2.07) | N | 1.35 (0.33, 5.5) | 0.62 (0.24, 1.6) | 2.65 (0.7, 10.06) | 1.3 (0.23, 7.38) | 3.49 (1.67, 7.3)‡ |
| N+T | 2.12 (0.42, 10.76) | 0.23 (0.02, 2.2) | 0.74 (0.18, 3.01) | N+T | 0.46 (0.1, 2.2) | 1.96 (0.33, 11.65) | 0.96 (0.12, 7.86) | 2.58 (0.64, 10.42) |
| T | 4.61 (1.35, 15.79)‡ | 0.49 (0.09, 2.77) | 1.61 (0.62, 4.15) | 2.18 (0.46, 10.41) | T | 4.26 (1.02, 17.77)‡ | 2.09 (0.34, 12.77) | 5.62 (2.28, 13.85)‡ |
| U | 1.08 (0.25, 4.74) | 0.12 (0.01, 1.03) | 0.38 (0.1, 1.44) | 0.51 (0.09, 3.04) | 0.23 (0.06, 0.98)‡ | U | 0.49 (0.07, 3.49) | 1.32 (0.42, 4.16) |
| V | 2.2 (0.35, 14) | 0.24 (0.02, 2.73) | 0.77 (0.14, 4.38) | 1.04 (0.13, 8.51) | 0.48 (0.08, 2.92) | 2.04 (0.29, 14.48) | V | 2.69 (0.54, 13.33) |
| P | 0.82 (0.31, 2.14) | 0.09 (0.01, 0.58)‡ | 0.29 (0.14, 0.6)‡ | 0.39 (0.1, 1.56) | 0.18 (0.07, 0.44)‡ | 0.76 (0.24, 2.39) | 0.37 (0.08, 1.84) | P |
See Figure H-1A for code. Results are given as odds ratios (95% confidence intervals). Values above the diagonal >1 favor the row intervention (to the left) over the column intervention (below). Shaded cells indicate indirect comparisons.
Table H-1BOdds ratios for cure between all intervention categories: stress UI (subgraph 2)
| C+H | C+H | 1 (0.02, 52.09) |
|---|---|---|
| H | 1 (0.02, 52.09) | H |
See Figure H-1A for code. Results are given as odds ratios (95% confidence intervals). Values above the diagonal >1 favor the row intervention (to the left) over the column intervention (below). Shaded cells indicate indirect comparisons.
Table H-2Odds ratios for cure between all intervention categories: urgency UI
| B | B | 2.74 (1.62, 4.63)‡ | 2.17 (1.01, 4.67)‡ | 1.68 (0.8, 3.55) | 1.8 (0.89, 3.63) | 4.94 (2.82, 8.65)‡ |
|---|---|---|---|---|---|---|
| C | 0.36 (0.22, 0.62)‡ | C | 0.79 (0.45, 1.4) | 0.61 (0.32, 1.16) | 0.66 (0.39, 1.11) | 1.8 (1.29, 2.52)‡ |
| C+T | 0.46 (0.21, 0.99)‡ | 1.26 (0.72, 2.23) | C+T | 0.77 (0.33, 1.81) | 0.83 (0.38, 1.8) | 2.28 (1.18, 4.39)‡ |
| N | 0.59 (0.28, 1.25) | 1.63 (0.86, 3.09) | 1.29 (0.55, 3.02) | N | 1.07 (0.55, 2.08) | 2.94 (1.47, 5.88)‡ |
| T | 0.56 (0.28, 1.12) | 1.53 (0.9, 2.6) | 1.21 (0.56, 2.62) | 0.94 (0.48, 1.82) | T | 2.75 (1.53, 4.92)‡ |
| P | 0.2 (0.12, 0.35)‡ | 0.56 (0.4, 0.78)‡ | 0.44 (0.23, 0.85)‡ | 0.34 (0.17, 0.68)‡ | 0.36 (0.2, 0.65)‡ | P |
See Figure H-1B for code. Results are given as odds ratios (95% confidence intervals). Values above the diagonal >1 favor the row intervention (to the left) over the column intervention (below). Shaded cells indicate indirect comparisons.
Table H-3AOdds ratios for cure between all intervention categories: older women (subgraph 1)
| C | C | 0.58 (0.1, 3.27) | 0.09 (0.02, 0.47)‡ | 0.09 (0.02, 0.48)‡ | 0.36 (0.14, 0.92)‡ | 1.38 (0.49, 3.83) |
|---|---|---|---|---|---|---|
| H+N+T | 1.71 (0.31, 9.6) | H+N+T | 0.15 (0.02, 1.18) | 0.15 (0.02, 1.22) | 0.62 (0.13, 2.96) | 2.36 (0.48, 11.71) |
| H+T | 11.71 (2.15, 63.72)‡ | 6.83 (0.85, 55) | H+T | 1.03 (0.13, 8.1) | 4.24 (0.95, 18.94) | 16.1 (3.29, 78.7)‡ |
| N+T | 11.37 (2.09, 61.97)‡ | 6.63 (0.82, 53.44) | 0.97 (0.12, 7.64) | N+T | 4.12 (0.92, 18.46) | 15.64 (3.2, 76.55)‡ |
| T | 2.76 (1.09, 6.99)‡ | 1.61 (0.34, 7.69) | 0.24 (0.05, 1.05) | 0.24 (0.05, 1.09) | T | 3.8 (1.87, 7.73)‡ |
| P | 0.73 (0.26, 2.03) | 0.42 (0.09, 2.1) | 0.06 (0.01, 0.3)‡ | 0.06 (0.01, 0.31)‡ | 0.26 (0.13, 0.54)‡ | P |
See Figure H-4 for code. Results are given as odds ratios (95% confidence intervals). Values above the diagonal >1 favor the row intervention (to the left) over the column intervention (below). Shaded cells indicate indirect comparisons.
Table H-3BOdds ratios for cure between all intervention categories: older women (subgraph 2)
| C+H | C+H | 1 (0.02, 52.09) |
|---|---|---|
| H | 1 (0.02, 52.09) | H |
See Figure H-4 for code. Results are given as odds ratios (95% confidence intervals). Values above the diagonal >1 favor the row intervention (to the left) over the column intervention (below). Shaded cells indicate indirect comparisons.
Table H-4Odds ratios for improvement between all intervention categories: stress UI
| A | A | 2.57 (0.48, 13.84) | 4.5 (1.14, 17.78)‡ | 0.2 (0.04, 0.96)‡ | 0.57 (0.34, 0.97)‡ | 2.3 (0.73, 7.22) | 0.33 (0.14, 0.77)‡ | 1.16 (0.41, 3.27) | 0.52 (0.16, 1.67) | 2.28 (1.6, 3.27)‡ |
|---|---|---|---|---|---|---|---|---|---|---|
| C+H | 0.39 (0.07, 2.1) | C+H | 1.75 (0.47, 6.53) | 0.08 (0.01, 0.42)‡ | 0.22 (0.04, 1.21) | 0.9 (0.13, 6.37) | 0.13 (0.02, 0.78)‡ | 0.45 (0.07, 3.08) | 0.2 (0.03, 1.48) | 0.89 (0.17, 4.71) |
| H | 0.22 (0.06, 0.88)‡ | 0.57 (0.15, 2.12) | H | 0.04 (0.01, 0.14)‡ | 0.13 (0.03, 0.51)‡ | 0.51 (0.09, 2.8) | 0.07 (0.02, 0.33)‡ | 0.26 (0.05, 1.34) | 0.12 (0.02, 0.65)‡ | 0.51 (0.13, 1.96) |
| H+N+T | 5.09 (1.04, 24.98)‡ | 13.07 (2.39, 71.59)‡ | 22.91 (7.24, 72.5)‡ | H+N+T | 2.91 (0.59, 14.41) | 11.71 (1.79, 76.75)‡ | 1.66 (0.3, 9.29) | 5.92 (0.95, 37.01) | 2.66 (0.39, 17.88) | 11.64 (2.42, 55.87)‡ |
| N | 1.75 (1.03, 2.97)‡ | 4.49 (0.83, 24.44) | 7.87 (1.97, 31.47)‡ | 0.34 (0.07, 1.7) | N | 4.02 (1.3, 12.49)‡ | 0.57 (0.24, 1.36) | 2.03 (0.7, 5.9) | 0.91 (0.28, 3.01) | 4.00 (2.56, 6.24)‡ |
| N+T | 0.43 (0.14, 1.37) | 1.12 (0.16, 7.93) | 1.96 (0.36, 10.73) | 0.09 (0.01, 0.56)‡ | 0.25 (0.08, 0.77)‡ | N+T | 0.14 (0.04, 0.54)‡ | 0.51 (0.12, 2.18) | 0.23 (0.05, 1.08) | 0.99 (0.33, 2.99) |
| T | 3.07 (1.3, 7.25)‡ | 7.88 (1.29, 48.17)‡ | 13.81 (3, 63.52)‡ | 0.6 (0.11, 3.37) | 1.75 (0.73, 4.19) | 7.06 (1.85, 26.86)‡ | T | 3.57 (1.02, 12.47)‡ | 1.6 (0.41, 6.25) | 7.01 (3.16, 15.58)‡ |
| U | 0.86 (0.31, 2.42) | 2.21 (0.32, 15) | 3.87 (0.74, 20.13) | 0.17 (0.03, 1.06) | 0.49 (0.17, 1.42) | 1.98 (0.46, 8.54) | 0.28 (0.08, 0.98)‡ | U | 0.45 (0.1, 1.97) | 1.97 (0.74, 5.2) |
| V | 1.92 (0.6, 6.16) | 4.92 (0.67, 35.88) | 8.63 (1.53, 48.7)‡ | 0.38 (0.06, 2.53) | 1.1 (0.33, 3.61) | 4.41 (0.93, 20.94) | 0.62 (0.16, 2.44) | 2.23 (0.51, 9.77) | V | 4.38 (1.44, 13.37)‡ |
| P | 0.44 (0.31, 0.63)‡ | 1.12 (0.21, 5.94) | 1.97 (0.51, 7.59) | 0.09 (0.02, 0.41)‡ | 0.25 (0.16, 0.39)‡ | 1.01 (0.33, 3.03) | 0.14 (0.06, 0.32)‡ | 0.51 (0.19, 1.35) | 0.23 (0.07, 0.7)‡ | P |
See Figure H-2A for code. Results are given as odds ratios (95% confidence intervals). Values above the diagonal >1 favor the row intervention (to the left) over the column intervention (below). Shaded cells indicate indirect comparisons.
Table H-5Odds ratios for improvement between all intervention categories: urgency UI
| B | B | 2.02 (1.14, 3.6)‡ | 0.94 (0.42, 2.1) | 0.83 (0.45, 1.53) | 0.48 (0.16, 1.47) | 3.62 (1.8, 7.28)‡ |
|---|---|---|---|---|---|---|
| C | 0.49 (0.28, 0.88)‡ | C | 0.46 (0.26, 0.82)‡ | 0.41 (0.21, 0.81)‡ | 0.24 (0.09, 0.62)‡ | 1.79 (1.18, 2.7)‡ |
| C+T | 1.07 (0.48, 2.4) | 2.16 (1.22, 3.85)‡ | C+T | 0.89 (0.37, 2.15) | 0.52 (0.17, 1.57) | 3.87 (1.92, 7.8)‡ |
| N | 1.21 (0.65, 2.23) | 2.44 (1.23, 4.83)‡ | 1.13 (0.46, 2.74) | N | 0.58 (0.18, 1.87) | 4.36 (1.98, 9.59)‡ |
| T | 2.07 (0.68, 6.31) | 4.2 (1.61, 10.94)‡ | 1.94 (0.64, 5.91) | 1.72 (0.53, 5.55) | T | 7.5 (2.88, 19.54)‡ |
| P | 0.28 (0.14, 0.56)‡ | 0.56 (0.37, 0.85)‡ | 0.26 (0.13, 0.52)‡ | 0.23 (0.1, 0.5)‡ | 0.13 (0.05, 0.35)‡ | P |
See Figure H-2B for code. Results are given as odds ratios (95% confidence intervals). Values above the diagonal >1 favor the row intervention (to the left) over the column intervention (below). Shaded cells indicate indirect comparisons.
Table H-6Odds ratios for improvement between all intervention categories: older women
| A | A | 0.20 (0.03, 1.36) | 0.46 (0.04, 5.66) | 1.10 (0.13, 9.45) | 0.12 (0.01, 0.92)‡ | 0.39 (0.03, 4.74) | 0.17 (0.03, 0.97)‡ | 1 (0.19, 5.37) |
|---|---|---|---|---|---|---|---|---|
| C | 5.01 (0.74, 34.06) | C | 2.31 (0.28, 19.18) | 5.53 (1.03, 29.56)‡ | 0.58 (0.12, 2.84) | 1.94 (0.24, 15.82) | 0.84 (0.3, 2.4) | 5.03 (1.77, 14.34)‡ |
| C+H | 2.17 (0.18, 26.62) | 0.43 (0.05, 3.6) | C+H | 2.4 (0.36, 15.83) | 0.25 (0.03, 2.14) | 0.84 (0.06, 11.83) | 0.36 (0.05, 2.61) | 2.18 (0.31, 15.47) |
| H | 0.91 (0.11, 7.75) | 0.18 (0.03, 0.97)‡ | 0.42 (0.06, 2.76) | H | 0.1 (0.02, 0.5)‡ | 0.35 (0.03, 3.53) | 0.15 (0.03, 0.67)‡ | 0.91 (0.21, 3.95) |
| H+N+T | 8.68 (1.09, 69.47)‡ | 1.73 (0.35, 8.52) | 4 (0.47, 34.31) | 9.59 (2, 45.87)‡ | H+N+T | 3.36 (0.35, 32.07) | 1.46 (0.36, 5.84) | 8.72 (2.27, 33.49)‡ |
| N | 2.58 (0.21, 31.61) | 0.52 (0.06, 4.2) | 1.19 (0.08, 16.76) | 2.85 (0.28, 28.68) | 0.3 (0.03, 2.83) | N | 0.43 (0.06, 2.9) | 2.59 (0.37, 18.14) |
| T | 5.95 (1.04, 34.21)‡ | 1.19 (0.42, 3.38) | 2.74 (0.38, 19.62) | 6.57 (1.49, 28.95)‡ | 0.69 (0.17, 2.74) | 2.3 (0.35, 15.39) | T | 5.98 (3, 11.91)‡ |
| P | 1 (0.19, 5.32) | 0.2 (0.07, 0.57)‡ | 0.46 (0.06, 3.26) | 1.1 (0.25, 4.77) | 0.11 (0.03, 0.44)‡ | 0.39 (0.06, 2.7) | 0.17 (0.08, 0.33)‡ | P |
See Figure H-5 for code. Results are given as odds ratios (95% confidence intervals). Values above the diagonal >1 favor the row intervention (to the left) over the column intervention (below). Shaded cells indicate indirect comparisons.
Table H-7Odds ratios for satisfaction between all intervention categories: stress UI
| N | N | 1.53 (0.51, 4.59) | 8.36 (4.75, 14.72)‡ |
|---|---|---|---|
| T | 0.65 (0.22, 1.95) | T | 5.45 (1.78, 16.69)‡ |
| P | 0.12 (0.07, 0.21)‡ | 0.18 (0.06, 0.56)‡ | P |
See Figure H-3A for code. Results are given as odds ratios (95% confidence intervals). Values above the diagonal >1 favor the row intervention (to the left) over the column intervention (below). Shaded cells indicate indirect comparisons.
Table H-8AOdds ratios for satisfaction between all intervention categories: urgency UI (subgraph 1)
| C | C | 0.8 (0.26, 2.5) | 0.32 (0.07, 1.41) | 2.6 (0.57, 11.87) |
|---|---|---|---|---|
| C+T | 1.25 (0.4, 3.88) | C+T | 0.39 (0.06, 2.48) | 3.24 (0.5, 20.75) |
| T | 3.16 (0.71, 14.09) | 2.53 (0.4, 15.93) | T | 8.2 (1.7, 39.43)‡ |
| P | 0.39 (0.08, 1.76) | 0.31 (0.05, 1.98) | 0.12 (0.03, 0.59)‡ | P |
See Figure H-3B for code. Results are given as odds ratios (95% confidence intervals). Values above the diagonal >1 favor the row intervention (to the left) over the column intervention (below). Shaded cells indicate indirect comparisons.
Table H-8BOdds ratios for satisfaction between all intervention categories: urgency UI (subgraph 2)
| B | B | 1.4 (0.93, 2.12) |
|---|---|---|
| N | 0.71 (0.47, 1.08) | N |
See Figure H-3B for code. Results are given as odds ratios (95% confidence intervals). Values above the diagonal >1 favor the row intervention (to the left) over the column intervention (below). Shaded cells indicate indirect comparisons.
Table H-9Odds ratios for satisfaction between all intervention categories: older women
| C | C | 0.29 (0.14, 0.57)‡ | 2.3 (1.11, 4.75)‡ |
|---|---|---|---|
| T | 3.48 (1.74, 6.96)‡ | T | 8.01 (4.01, 15.98)‡ |
| P | 0.43 (0.21, 0.9)‡ | 0.12 (0.06, 0.25)‡ | P |
See Figure H-6 for code. Results are given as odds ratios (95% confidence intervals). Values above the diagonal >1 favor the row intervention (to the left) over the column intervention (below). Shaded cells indicate indirect comparisons.
Table H-10Estimated and forecast rates of cure by intervention category: stress and urgency UI
| Stress UI | Urgency UI | ||||
|---|---|---|---|---|---|
| Intervention category | Mean Percent* (95% CI) | Forecast Percent† (95% CI) | Intervention category | Mean Percent* (95% CI) | Forecast Percent† (95% CI) |
| Pharmacological | Pharmacological | ||||
| BTX (B) | 42.8 (27.2, 60.0) | 42.8 (8.9, 85.1) | |||
| Anticholinergic (C) | 21.4 (12.8, 33.6) | 21.4 (3.5, 67.0) | |||
| Periurethral Bulking (U) | 16.9 (5.3, 42.4) | 16.9 (1.0, 80.2) | |||
| Alpha Agonist (A) | 15.8 (6.1, 35.3) | 15.8 (1.0, 77.4) | |||
| Anticholinergic + Hormones (C+H) | 1.7 (0.1, 21.7) | 1.7 (0.1, 21.7) | |||
| Hormones (H) | 1.7 (0.1, 21.7) | 1.7 (0.1, 21.7) | |||
| Nonpharmacological | Nonpharmacological | ||||
| Behavioral Therapy (T) | 46.4 (25.8, 68.3) | 46.4 (4.8, 93.7) | Behavioral Therapy (T) | 30.8 (16.7, 49.8) | 30.8 (5.3, 77.9) |
| Neuromodulation (N) | 34.9 (19.5, 54.4) | 34.9 (3.1, 90.0) | Neuromodulation (N) | 29.4 (16.6, 46.5) | 29.4 (5.1, 76.3) |
| Intravesical pressure release (V) | 29.2 (7.0, 69.3) | 29.2 (1.7, 91.0) | |||
| Neuromodulation + Behavioral Therapy (N+T) | 28.4 (8.7, 62.2) | 28.4 (1.8, 89.4) | |||
| Combination | Combination | ||||
| Hormones + Behavioral Therapy (H+T) | 63.7 (21.4, 91.9) | 63.7 (6.2, 97.9) | |||
| Anticholinergic + Behavioral Therapy (C+T) | 25.7 (13.2, 43.8) | 25.7 (4.1, 73.4) | |||
| No Treatment | No Treatment | ||||
| Placebo/Sham/No Treatment (P) | 13.3 (6.9, 24.2) | 13.3 (0.9, 71.7) | Placebo/Sham/No Treatment (P) | 13.2 (7.3, 22.7) | 13.2 (2.0, 53.3) |
- *
The summary mean percentage (with confidence interval) of women in the trials receiving the intervention with the outcome.
- †
The predicted percentage (with confidence interval) of women who receive the intervention in future trials, or in similar settings, who will have the outcome.
Table H-11Estimated and forecast rates of cure by intervention category: older women
| Intervention category | Mean Percent* (95% CI) | Forecast Percent† (95% CI) |
|---|---|---|
| First Subgraph | ||
| Pharmacological | ||
| Anticholinergic (C) | 16.7 (7.7, 32.5) | 16.7 (4.1, 48.6) |
| Nonpharmacological | ||
| Neuromodulation + Behavioral Therapy (N+T) | 69.5 (34.5, 90.8) | 69.5 (24.6, 94.1) |
| Behavioral Therapy (T) | 35.6 (25.2, 47.7) | 35.6 (12.3, 68.6) |
| Combination | ||
| Hormones + Behavioral Therapy (H+T) | 70.1 (35.1, 91.0) | 70.1 (25.1, 94.3) |
| Hormones + Neuromodulation + Behavioral Therapy (H+N+T) | 25.6 (7.2, 60.3) | 25.6 (4.6, 71.0) |
| No treatment | ||
| Placebo/Sham/No Treatment (P) | 12.7 (7.1, 21.8) | 12.7 (3.4, 38.0) |
| Second Subgraph | ||
| Pharmacological | ||
| Hormones (H) | 1.7 (0.1, 21.7) | 1.7 (0.1, 21.7) |
| Anticholinergic + Hormones (C+H) | 1.7 (0.1, 21.7) | 1.7 (0.1, 21.7) |
- *
The summary mean percentage (with confidence interval) of women in the trials receiving the intervention with the outcome.
- †
The predicted percentage (with confidence interval) of women who receive the intervention in future trials, or in similar settings, who will have the outcome.
Table H-12Estimated and forecast rates of improvement by intervention category: stress and urgency UI
| Stress UI | Urgency UI | ||||
|---|---|---|---|---|---|
| Intervention category | Mean Percent* (95% CI) | Forecast Percent† (95% CI) | Intervention category | Mean Percent* (95% CI) | Forecast Percent† (95% CI) |
| Pharmacological | Pharmacological | ||||
| Alpha Agonist (A) | 46.0 (34.1, 58.4) | 46.0 (11.1, 85.3) | |||
| Periurethral Bulking (U) | 42.3 (20.6, 67.4) | 42.3 (8.0, 86.0) | |||
| Anticholinergic + Hormones (C+H) | 24.9 (6.2, 62.5) | 24.9 (2.8, 79.5) | |||
| Hormones (H) | 15.9 (5.0, 40.6) | 15.9 (1.9, 64.4) | |||
| BTX (B) | 75.3 (58.5, 86.8) | 75.3 (28.6, 95.9) | |||
| Anticholinergic (C) | 60.1 (45.2, 73.3) | 60.1 (17.3, 91.5) | |||
| Nonpharmacological | Nonpharmacological | ||||
| Behavioral Therapy (T) | 72.3 (53.3, 85.7) | 72.3 (25.6, 95.2) | Behavioral Therapy (T) | 86.3 (67.8, 95.0) | 86.3 (41.8, 98.2) |
| Intravesical Pressure Release (V) | 62.0 (33.8, 84.0) | 62.0 (15.5, 93.6) | |||
| Neuromodulation (N) | 59.8 (46.8, 71.7) | 59.8 (17.8, 91.1) | Neuromodulation (N) | 78.6 (61.4, 89.4) | 78.6 (31.9, 96.6) |
| Neuromodulation + Behavioral Therapy (N+T) | 27.0 (10.8, 53.1) | 27.0 (4.1, 76.3) | |||
| Combination | Combination | ||||
| Hormones + Neuromodulation + Behavioral Therapy (H+N+T) | 81.3 (48.9, 95.2) | 81.3 (28.4, 97.9) | |||
| Anticholinergic + Behavioral Therapy (C+T) | 76.5 (59.7, 87.7) | 76.5 (29.8, 96.1) | |||
| No Treatment | No Treatment | ||||
| Placebo/Sham/No Treatment (P) | 27.2 (19.5, 36.4) | 27.2 (5.3, 71.4) | Placebo/Sham/No Treatment (P) | 45.7 (30.2, 62.1) | 45.7 (10.3, 86.1) |
- *
The summary mean percentage (with confidence interval) of women in the trials receiving the intervention with the outcome.
- †
The predicted percentage (with confidence interval) of women who receive the intervention in future trials, or in similar settings, who will have the outcome.
Table H-13Estimated and forecast rates of improvement by intervention category: older women
| Intervention category | Mean Percent* (95% CI) | Forecast Percent† (95% CI) |
|---|---|---|
| Pharmacological | ||
| Anticholinergic (C) | 52.3 (28.7, 75.0) | 52.3 (11.7, 90.1) |
| Anticholinergic + Hormones (C+H) | 32.2 (6.9, 75.4) | 32.2 (3.3, 86.8) |
| Alpha Agonist (A) | 18.0 (3.9, 54.0) | 18.0 (1.8, 72.8) |
| Hormones (H) | 16.6 (4.9, 43.3) | 16.6 (2.0, 66.3) |
| Nonpharmacological | ||
| Neuromodulation + Behavioral Therapy (N+T) | 69.5 (34.5, 90.8) | 69.5 (24.6, 94.1) |
| Behavioral Therapy (T) | 56.6 (40.9, 71.1) | 56.6 (15.5, 90.3) |
| Neuromodulation (N) | 36.1 (8.0, 78.7) | 36.1 (3.9, 88.8) |
| Combination | ||
| Hormones + Neuromodulation + Behavioral Therapy (H+N+T) | 65.5 (35.0, 87.0) | 65.5 (16.8, 94.7) |
| No treatment | ||
| Placebo/Sham/No Treatment (P) | 17.9 (10.5, 28.9) | 17.9 (3.0, 60.7) |
- *
The summary mean percentage (with confidence interval) of women in the trials receiving the intervention with the outcome.
- †
The predicted percentage (with confidence interval) of women who receive the intervention in future trials, or in similar settings, who will have the outcome.
Table H-14Estimated and forecast rates of satisfaction by intervention category: stress and urgency UI
| Stress UI | Urgency UI | ||||
|---|---|---|---|---|---|
| Intervention category | Mean Percent* (95% CI) | Forecast Percent† (95% CI) | Intervention category | Mean Percent* (95% CI) | Forecast Percent† (95% CI) |
| Pharmacological | Pharmacological | ||||
| BTX (B) | 59.5 (52.3, 66.2) | 59.5 (52.3, 66.2) | |||
| Anticholinergic (C) | 48.9 (16.3, 82.5) | 48.9 (4.1, 95.6) | |||
| Nonpharmacological | Nonpharmacological | ||||
| Neuromodulation (N) | 81.8 (62.2, 92.4) | 81.8 (35.3, 97.4) | Neuromodulation (N) | 51.1 (43.8, 58.5) | 51.1 (43.8, 58.5) |
| Behavioral Therapy (T) | 74.5 (43.1, 91.8) | 74.5 (22.8, 96.7) | Behavioral Therapy (T) | 75.1 (29.1, 95.7) | 75.1 (9.7, 98.8) |
| Combination | Combination | ||||
| Anticholinergic + Behavioral Therapy (C+T) | 54.4 (17.9, 86.7) | 54.4 (4.7, 96.6) | |||
| No Treatment | No Treatment | ||||
| Placebo/Sham/No Treatment (P) | 34.9 (16.9, 58.6) | 34.9 (6.2, 81.3) | Placebo/Sham/No Treatment (P) | 26.9 (4.7, 73.4) | 26.9 (1.3, 91.3) |
- *
The summary mean percentage (with confidence interval) of women in the trials receiving the intervention with the outcome.
- †
The predicted percentage (with confidence interval) of women who receive the intervention in future trials, or in similar settings, who will have the outcome.
Table H-15Estimated and forecast rates of satisfaction by intervention category: older women
| Intervention category | Mean Percent* (95% CI) | Forecast Percent† (95% CI) |
|---|---|---|
| Pharmacological | ||
| Anticholinergic (C) | 46.7 (27.2, 67.3) | 46.7 (20.6, 74.7) |
| Nonpharmacological | ||
| Behavioral Therapy (T) | 75.3 (57.8, 87.2) | 75.3 (48.3, 90.9) |
| No treatment | ||
| Placebo/Sham/No Treatment (P) | 27.6 (14.6, 46.0) | 27.6 (10.5, 55.4) |
- *
The summary mean percentage (with confidence interval) of women in the trials receiving the intervention with the outcome.
- †
The predicted percentage (with confidence interval) of women who receive the intervention in future trials, or in similar settings, who will have the outcome.
- Results of Subgroup Analyses by Type of UI - Nonsurgical Treatments for Urinary ...Results of Subgroup Analyses by Type of UI - Nonsurgical Treatments for Urinary Incontinence in Women: A Systematic Review Update
Your browsing activity is empty.
Activity recording is turned off.
See more...