

NCBI Bookshelf. A service of the National Library of Medicine, National Institutes of Health.
Feingold KR, Anawalt B, Blackman MR, et al., editors. Endotext [Internet]. South Dartmouth (MA): MDText.com, Inc.; 2000-.

ABSTRACT
MRI is the primary imaging modality for the pituitary gland. This chapter reviews and illustrates the normal anatomy and MRI appearances of the pituitary gland and hypothalamic region. The optimal MRI technique relies on thin section T1-weighted sequences in the sagittal and coronal planes before and after gadolinium contrast enhancement. T2-weighted sequences can add useful additional information in some cases but are not a substitute for T1-weighted sequences. Congenital abnormalities with characteristic imaging appearances including the ectopic posterior pituitary and hypothalamic hamartoma are illustrated, along with images of all the common primary pituitary pathologies: adenomas, Rathke’s cysts and hypophysitis (infundibular, lymphocytic, and immunotherapy drug-induced). Non-pituitary origin pathologies which may involve the pituitary or parasellar region are also illustrated, including meningioma, arachnoid cysts, germinoma, craniopharyngioma and chondrosarcoma; they all have distinct imaging appearances. Inflammatory processes such as sarcoid or Langerhans cell histiocytosis can also involve the pituitary stalk or hypothalamus and in these cases diabetes insipidus may be a clinical feature, correlating with stalk involvement on imaging. More recently, IgG4- and immune checkpoint inhibitor-associated hypophysitis have emerged as new diseases entities. Metastases or lymphoma can occasionally involve the pituitary gland and stalk. The granular cell tumor is a rare tumor arising in the pituitary stalk and has a typical appearance, distinct from other inflammatory or infiltrative stalk processes. For complete coverage of all related areas of Endocrinology, please visit our on-line FREE web-text, WWW.ENDOTEXT.ORG.
ANATOMY AND EMBRYOLOGY
The pituitary gland sits within the sella turcica which is a cup-shaped depression in the sphenoid bone. The sphenoid air sinus lies below and anterior to the sella turcica (Fig 1). Lying above the pituitary gland is a cerebrospinal fluid (CSF) space, the suprasellar system, which contains the optic chiasm (Figs 1 and 2). The lateral walls of the pituitary fossa are formed by the cavernous sinuses (Fig 1B) which contain the internal carotid arteries as well as a number of cranial nerves: the 3rd, 4th and 6th cranial nerves as well as the first and second divisions of the 5th cranial nerve. The pituitary gland is connected via the pituitary stalk to the hypothalamus, which is a thin plate of tissue making up the floor of the anterior part of the 3rd ventricle (Figs 1 and 3).

Figure 1.
Sagittal T1 weighted unenhanced image of the pituitary fossa demonstrate normal anatomy. The anterior pituitary tissue, A, is visible within the sella and the posterior pituitary bright spot, P, is evident behind it. The stalk (arrow) is well seen with a small cleft of CSF visible within it superiorly –the infundibular recess of the third ventricle. The optic chiasm, C, and mamillary bodies, M, are seen in the suprasellar region. B - brainstem, S - sphenoid air sinus, CL - clivus.

Figure 2.
Coronal T1 weighted unenhanced image of the pituitary fossa. The anterior pituitary gland, A, is within the fossa. The posterior pituitary bright spot is visible centrally, P. The stalk is seen extending up into the suprasellar region. The optic chiasm, C, is visible. The cavernous segments of the carotid arteries, I, are seen within the cavernous sinuses, which form the lateral boundaries of the pituitary fossa.

Figure 3.
Sagittal T1 weighted enhanced image of the pituitary. The pituitary tissue has enhanced, as has the pituitary stalk.
The appearance and size of the pituitary gland changes during life. At birth, it is typically globular in shape and shows high signal on T1 weighted images (1). By approximately 6 weeks of age this high signal has diminished, and the anterior pituitary tissue has a similar signal to brain tissue. The posterior pituitary tissue, however, retains a bright signal on T1 weighted sequences. This so-called “posterior pituitary bright spot” is a normal appearance thought to be due to the high neurophysin content (which is not present in the anterior pituitary tissue) (Fig 1).
The size of the pituitary gland varies with age and sex. On average it is between 3 and 8mm in height but is generally larger in females than males. The height increases during adolescence due to normal physiological hypertrophy (2). There is also a slight increase in size seen during the sixth decade in females. The most striking physiological changes are seen during pregnancy when the gland progressively enlarges reaching a maximal height immediately after birth when it may reach 10mm in height (3).
Embryologically, the anterior and posterior pituitary lobes are distinct. The anterior lobe forms from an invagination of the oral ectoderm known as Rathke’s Pouch. The posterior pituitary forms from a protrusion of the neural ectoderm of the diencephalon. Between the anterior and posterior lobes lies an intermediate lobe which is vestigial and known as the pars intermedia. This is a potential site for small non-functional Rathke’s cysts (Fig 4).

Figure 4.
Sagittal enhanced T1 weighted image demonstrating a small Rathke’s cyst. This is seen to lie just below the insertion of the pituitary stalk and centrally within the gland. Although it is possible that a small cystic adenoma could have these appearances, this is a very typical location for a Rathke’s cyst arising in the pars intermedia.
MR IMAGING
MR is the imaging of choice for the pituitary gland. In order to optimize the study, it is necessary to perform thin sections (2mm or 3mm) targeted to the pituitary fossa and performed in both the sagittal and coronal planes. T1 weighted sequences before and after intravenous contrast are the mainstay of pituitary imaging (Fig 1-3) (4). Coronal T2 weighted sequences can also give added information but are less sensitive in the detection of adenomas. Sequences before and after intravenous contrast are the main stay of pituitary imaging (Fig 1-3). Coronal T2 weighted sequences can also give added information but are less sensitive in the detection of adenomas. The higher field strength 3 Tesla MR scanners, which are now in more widespread clinical use, can provide higher resolution pituitary images, the T2 images being reliably improved at 3T. However, artefacts related to vascular flow and patient movement are more pronounced and may outweigh the benefits. CT does not provide such excellent soft tissue resolution as MR but can be a very useful investigation if MR is not possible, and also if it is important to identify the presence of calcification in or around the sella. A dedicated CT study should be performed with a 1mm slice thickness in the axial plane and then reconstructed in the sagittal and coronal planes.
There can be some benefit in performing the post-contrast MR sequences in a dynamic fashion (within the first 60 seconds) after contrast injection. This can maximize the conspicuity of adenomas within the pituitary gland, which typically enhance less than the normal pituitary tissue, and this differential enhancement is sometimes best appreciated within the first arterial phase of the contrast injection (Figs 4 and 5) (5). However, in the majority of cases the lesions are adequately demonstrated on a standard acquisition (non-dynamic) scan after the contrast administration (Fig 7) (5).

Figure 5.
Coronal T1 weighted image of the pituitary gland before contrast. There is a microadenoma in the right side of the gland. On the unenhanced image there is evidence of depression of the floor of the sella on the right side but the microadenoma cannot be visualized within the gland.

Figure 6.
Coronal T1 weighted image of the pituitary gland immediately after contrast. There is a microadenoma in the right side of the gland. After contrast a dynamic acquisition shows an area of lesser enhancement indicative of a microadenoma.
%20which%20was%20best%20seen%20on%20this%20nondynamic%20post-contrast%20sequence.&p=BOOKS&id=279161_radiology-pituitary-Image007.jpg "Click on image to zoom")
Figure 7.
Coronal T1 weighted image of the pituitary gland that demonstrates a left sided microadenoma (arrow) which was best seen on this nondynamic post-contrast sequence.
The pituitary gland, pituitary stalk and cavernous sinuses are all vascular structures which are seen to enhance after gadolinium injection. The optic chiasm and hypothalamus, however, do not show enhancement if the blood brain barrier is intact (Figs 1-3).
PITUITARY ADENOMAS
Pituitary adenomas are by far the most common mass lesion seen in the sella and parasellar region. They are slow-growing benign neoplasms arising from the anterior pituitary tissue; radiologically they are simply classified by size: lesions smaller than 10mm transversely are termed microadenomas and those greater than 10mm are macroadenomas. The clinical classification separates adenomas into those that are hormonally activity, e.g., prolactinomas, and those that do not have measurable evidence of hormonal activity referred to as non-functioning adenomas. The histology of the so-called non-functioning adenoma suggests that these arise from gonadotroph cells. The imaging appearances of pituitary adenomas is similar whether they are hormonally functioning or not. Obviously, non-functioning adenomas are more likely to present when they have attained a significant size and are producing effects on local structures around the sella.
Pituitary Macroadenomas
Pituitary macroadenomas can extend superiorly into the suprasellar cistern (Figs 8-10) and impinge on the optic nerves and/or optic chiasm to produce visual field abnormalities (typically a bitemporal hemianopia). Pituitary macroadenomas with a large suprasellar component characteristically show the appearance of “waisting” (Figs 9 and 10) as they pass through the diaphragma sellae, the sheet of dura which normally lies above the pituitary gland. Lateral growth of a macroadenoma is initially seen to cause deformity of the cavernous sinus; however, adenomas can invade into the cavernous sinus. (Fig 11) This may be associated with symptoms or signs related to involvement of the cranial nerves that run in the cavernous sinus. The third, fourth and sixth cranial nerves run through the cavernous sinus, as do the first and second divisions of the fifth (trigeminal) nerve. If the MR imaging demonstrates adenoma tissue extending beyond the most lateral margin of the cavernous segment of the internal carotid artery then it is very likely that there is tumor within the cavernous sinus (6). In many cases, however, tumor simply deforms the cavernous sinus flattening the medial wall but not extending more laterally, and in these cases the tumor is typically confined to the sella and has not invaded into the cavernous sinus at surgery. Adenomas can also extend inferiorly into the sphenoid producing remodeling of the bone. Occasionally, macroadenomas will show a very extensive involvement of the skull base (Fig 12) and, exceptionally, can extend out into the infratemporal fossa.

Figure 8.
Sagittal T1 weighted unenhanced image of a macroadenoma. The sella is enlarged and the macroadenoma is seen to extend upwards into the suprasellar cistern with the optic chiasm stretched and deformed over the surface of the macroadenoma.
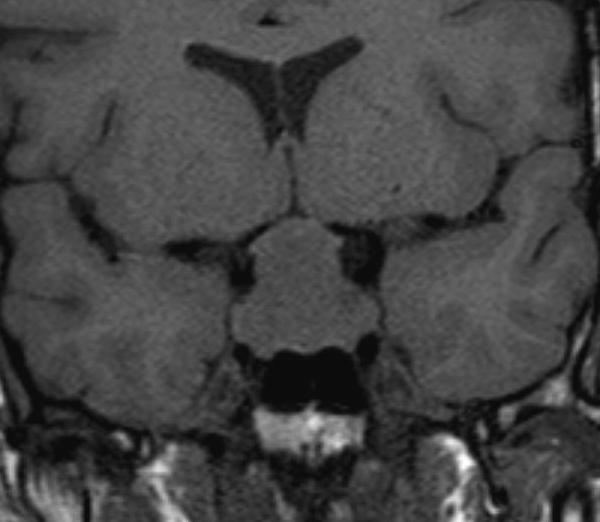
Figure 9.
Coronal T1 weighted unenhanced image of a macroadenoma. The sella is enlarged and the macroadenoma is seen to extend upwards into the suprasellar cistern with the optic chiasm stretched and deformed over the surface of the macroadenoma.

Figure 10.
A coronal T1 weighted enhanced image shows diffuse enhancement of the macroadenoma, no normal pituitary tissue can now be identified. The optic chiasm is easily identified, it does not enhance and is seen to be stretched over the superior aspect of the adenoma.

Figure 11.
A coronal enhanced T1 weighted image shows a right-sided pituitary adenoma that has invaded laterally into the right cavernous sinus. A significant component of the tumor lies lateral to the cavernous carotid artery and must therefore be within the cavernous sinus.

Figure 12.
A sagittal T1 weighted unenhanced image shows an invasive macroadenoma which has involved much of the central skull base. It has invaded the sphenoid air sinus which can no longer be identified and has also extended down the clivus. There is also a modest suprasellar extension with elevation of the optic chiasm.
When pituitary macroadenomas attain a certain size, it is no longer possible to identify any normal pituitary tissue within the sella. The posterior pituitary bright spot may also be difficult to identify but is often seen in the lower aspect of the pituitary stalk which itself may be markedly deformed by the adenoma. Despite these appearances it is very rare for patients with macroadenomas of the pituitary to have diabetes insipidus, which usually points to a different pathology within the pituitary gland or stalk. Macroadenomas may be homogeneous or heterogeneous in their MR signal characteristics. Areas of cystic change and focal areas of hemorrhage are not infrequently identified. It is not uncommon for areas of hemorrhage to be seen within macroadenomas without any correlating clinical event; however, significant hemorrhage with necrosis in an adenoma can produce the syndrome of pituitary apoplexy. The patient reports sudden onset of headache usually associated with visual disturbance. The MRI scan shows an enlarged sella containing a macroadenoma with areas of high T1 signal representing the hemorrhage (Figs 13 and 14). Often there is suprasellar extension and there may also be involvement of the cavernous sinus. Clinically, the patient may present with cranial nerve problems related to involvement of the cavernous sinus. Hemorrhage extending outside the tumor into the subarachnoid space is documented but is very rare.

Figure 13.
Sagittal T1 non-contrast image showing hemorrhage into an existing pituitary macroadenoma. The area of high signal represents the recent hemorrhage. There is a component of the tumor extending into the left cavernous sinus which does not show hemorrhage. The suprasellar extension is compressing the chiasm particularly on the right side.

Figure 14.
Coronal non-contrast image showing hemorrhage into an existing pituitary macroadenoma. The area of high signal represents the recent hemorrhage. There is a component of the tumor extending into the left cavernous sinus which does not show hemorrhage. The suprasellar extension is compressing the chiasm particularly on the right side.
Pituitary Microadenomas
Pituitary microadenomas are confined within the sella and are sometimes identified within the normal pituitary gland as an area of lower signal on T1 weighted sequences than the normal pituitary tissue (Fig 15). (7) Local remodeling of the floor of the sella (Fig 5) and remodeling of the dorsum are also useful features to identify the presence of a microadenoma. Although there may be displacement of the pituitary stalk by a lesion, this is not a very reliable indicator (8). Administration of intravenous gadolinium will improve the sensitivity of pituitary MR in identifying the presence of a microadenoma; typically the microadenomas enhance less avidly than the normal anterior pituitary tissue (Figs 5-7) Acquiring sequences dynamically within the first minute after intravenous injection can slightly further improve the sensitivity of the study (5). This will demonstrate adenomas that appear less vascular on the initial arterial phase of contrast enhancement but then equilibrate to show similar vascularity to the normal gland in the next few minutes. The use of volumetric T1W sequences after contrast (as compared to standard T1W spin echo -SE) improves the detection rate for microadenomas (9), and so is of particular use in Cushing’s disease. A fluid attenuated Inversion recovery (FLAIR) sequence after contrast may further improve the detection of Cushing’s adenomas, if used with the volumetric sequence, which has the highest individual sensitivity (10). The signal characteristics of GH-secreting adenomas on T2 weighted sequences (whether they are of lower or higher signal than adjacent grey matter) can be an indicator of their histological composition: densely granulated GH secreting adenomas are typically hypointense whilst sparsely granulated GH secreting adenomas are hyperintense. The low T2 signal (densely granulated) adenomas seemingly respond better to somatostatin analogues (11) (Fig 16).

Figure 15.
A coronal unenhanced T1 weighted image shows a small left sided microadenoma (arrow) as an area of lower signal than the rest of the anterior pituitary tissue.

Figure 16.
A coronal T2 weighted image shows a low T2 signal adenoma in the left side of the gland (arrow) which represented a densely granulated GH secreting adenoma.
After pituitary surgery it takes around 3 to 4 months for the postoperative changes within the sella to regress to allow for assessment of the true volume of residual pituitary tissue (12).
RATHKE’S CLEFT CYSTS
These benign, non-functioning cysts arise from remnants of squamous epithelium from Rathke’s cleft. They typically arise close to the insertion of the stalk (Fig 17) They are a common incidental finding reported in up to 11% of pituitary glands at autopsy (13). On imaging they may appear proteinaceous rendering their signal higher to the point that they appear hyperintense on the T1 weighted sequence. It is not uncommon for these cysts to lie in the suprasellar region on the surface of the gland where they are usually found anterior to the pituitary stalk (Figs 18 and 19). If they are of significant size, then it may be hard to distinguish a Rathke’s cyst from a cystic craniopharyngioma. However, it is notable that the wall of a Rathke’s cyst shows no more than minimal enhancement. There are no solid enhancing areas and they do not calcify. Rathke’s cysts can be found in all age groups.

Figure 17.
A coronal unenhanced T1 weighted image demonstrating a small Rathke’s cyst. This is seen to lie just below the insertion of the pituitary stalk and centrally within the gland. Although it is possible that a small cystic adenoma could have these appearances, this is a very typical location for a Rathke’s cyst.
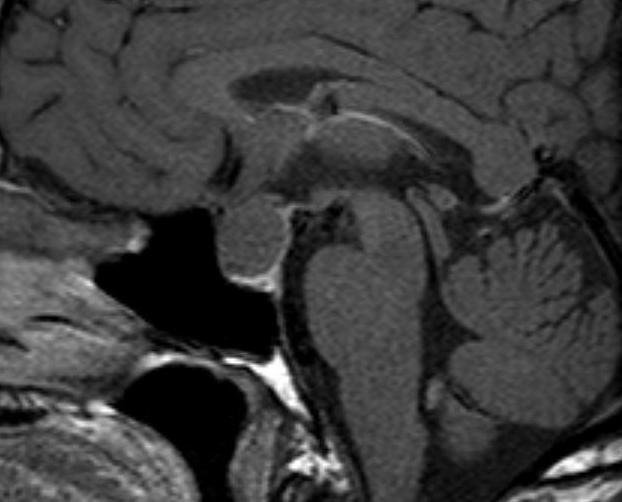
Figure 18.
Sagittal enhanced T1 weighted image of a large Rathke’s cyst. The cyst is seen to be sitting on the superior aspect of the pituitary tissue which appears flattened within the sella. The optic chiasm is stretched over the surface of the cyst. After contrast the cyst does not show enhancement. The cyst shows higher signal than the CSF indicating that it has a higher protein content.
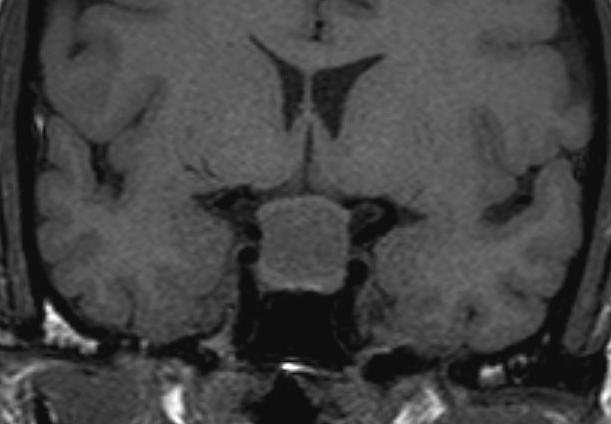
Figure 19.
Coronal unenhanced T1 weighted image of a large Rathke’s cyst. The cyst is seen to be sitting on the superior aspect of the pituitary tissue which appears flattened within the sella. The optic chiasm is stretched over the surface of the cyst. After contrast the cyst does not show enhancement. The cyst shows higher signal than the CSF indicating that it has a higher protein content.
MENINGIOMAS
Meningiomas are slow-growing neoplasms that arise from the dura and can arise from any of the dural surfaces around the sella. Suprasellar meningiomas appear as soft tissue mass lesions apparently sitting on the superior surface of the pituitary and often compressing or involving the optic chiasm and nerves (Fig 20) (14) A typical feature is a dural “tail” of enhancement seen extending forward along the planum sphenoidale (Fig 21). Meningiomas have very similar signal to both the brain parenchyma and the pituitary gland, but show prominent homogeneous enhancement after contrast. The dural tail is a helpful distinguishing feature to separate meningiomas from other sella tumors.

Figure 20.
Coronal enhanced T1 weighted image There is a suprasellar meningioma which appears to be arising from the planum sphenoidale and is seen extending along the floor of the anterior cranial fossa where a dural tail (arrow) is visible. The pituitary gland itself appears normal and a cleft of CSF is visible between the meningioma and the pituitary tissue. The meningioma is displacing and possibly involving the optic nerves anterior to the chiasm.

Figure 21.
Sagittal (B) enhanced T1 weighted image. There is a suprasellar meningioma which appears to be arising from the planum sphenoidale and is seen extending along the floor of the anterior cranial fossa where a dural tail (arrow) is visible. The pituitary gland itself appears normal and a cleft of CSF is visible between the meningioma and the pituitary tissue. The meningioma is displacing and possibly involving the optic nerves anterior to the chiasm.
Meningiomas can also arise from the cavernous sinus producing a soft tissue mass lying lateral to normal pituitary tissue. The meningioma may encase the cavernous carotid artery and can produce constriction of this vessel (Fig 22). This feature may be helpful in distinguishing between cavernous sinus extension of a pituitary tumor and a cavernous sinus meningioma. Pituitary tumors do not typically cause any vascular constriction. There may be hyperostosis (bony thickening) of any bony surface from which a meningioma has arisen, most typically the anterior clinoid process, though this may be more easily appreciated on CT than MR.
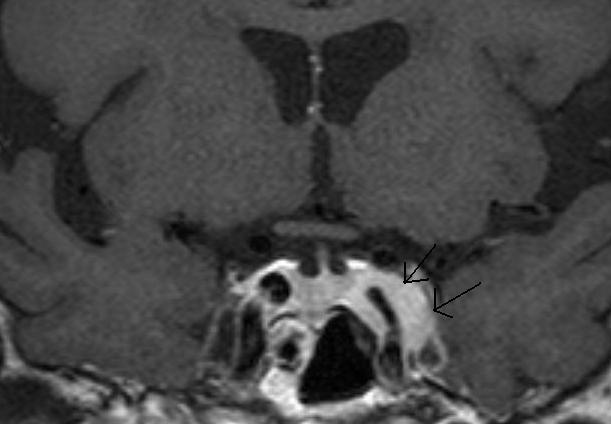
Figure 22.
A Coronal T1 weighted enhanced image of a left cavernous sinus meningioma. There is expansion of the left cavernous sinus (arrows) and some concentric narrowing of the left cavernous carotid artery (compare to the right carotid).
CRANIOPHARYNGIOMAS
Craniopharyngiomas are rare epithelial tumors arising in the sella/suprasellar region from the remnants of the craniopharyngeal duct. They are most commonly seen in children between 5 and 10 years of age; however, they can also occur in late adulthood in the sixth decade. They are the commonest lesion to involve the hypothalamic/pituitary region in children. In children it is the adamantinomatous histological subtype that is the most common (15). These shows both cystic and solid components as well as calcification, best appreciated on CT. The fluid within the cysts contains a high content of cholesterol as well as protein and desquamated cells, and this accounts for the cyst fluid often having high signal on T1 weighted unenhanced images (Fig 23) The solid enhancing tumor components are most easily seen after contrast injection (Fig 24). Craniopharyngiomas presenting in adulthood are more likely to be of the papillary subtype. These may be exclusively solid lesions (Fig 25 and 26) or show a mixed solid and cystic morphology (15). They do not typically calcify, and they are less locally infiltrative. The adamantinomatous subtype is particularly adherent to surrounding brain tissue and is therefore difficult to surgically resect; however, imaging cannot distinguish accurately between the histological subtypes. The imaging characteristics are those of a complex suprasellar mass containing both cystic and solid components, the solid components show enhancement after contrast (14). Large lesions may be associated with hydrocephalus (more commonly in children) while the cystic components may show variable signal characteristics from low signal to high signal on the T1 weighted sequences. (Fig 23).

Figure 23.
Sagittal T1 weighted unenhanced image showing a partially cystic craniopharyngioma. This is a large complex suprasellar mass which extends down into the pituitary fossa and up to deform the third ventricle. There are patchy areas of high signal before contrast which represent the cystic components with a high protein/ lipid content.

Figure 24.
Coronal enhanced image showing a partially cystic craniopharyngioma. This is a large complex suprasellar mass which extends down into the pituitary fossa and up to deform the third ventricle. It is of mixed signal intensity and the solid components enhance after contrast.

Figure 25.
Sagittal T1 weighted unenhanced image. This shows a solid suprasellar enhancing mass, a solid craniopharyngioma. This is elevating and deforming the chiasm but is not involving the pituitary gland itself which can be seen within the sella.

Figure 26.
Sagittal T1 weighted enhanced image. This shows a solid suprasellar enhancing mass, a solid craniopharyngioma. This is elevating and deforming the chiasm but is not involving the pituitary gland itself which can be seen within the sella. The mass enhances after contrast indicating that it is solid, and no cystic areas are evident.
HYPOTHALAMIC/OPTIC CHIASM GLIOMAS
These tumors present as suprasellar mass lesions and are most commonly seen in children. It is very often hard to determine whether the tumor has arisen in the optic chiasm or the hypothalamus as typically both of these structures are involved. These tumors are often associated with neurofibromatosis type I, in which case there is often involvement of the optic nerves and very often a significant cystic component is evident (14). Otherwise, these tumors appear as well-defined suprasellar mass lesions which may show enhancement (Fig 27 and 28) and may also show reactive signal change in the brain along the optic radiation. Calcification is not seen in these lesions.

Figure 27.
Sagittal T1 weighted enhanced image show a partially cystic and partially solid hypothalamic glioma in the suprasellar region. The mass is centered on the region of the optic chiasm and is flattening the pituitary stalk and hypothalamus. The pituitary gland is normal.

Figure 28.
T1 weighted coronal enhanced image show a partially cystic and partially solid hypothalamic glioma in the suprasellar region. The mass is centered on the region of the optic chiasm and is flattening the pituitary stalk and hypothalamus. The pituitary gland is normal.
GERMINOMA
These are rare intracranial germ cell tumors which most typically arise in the suprasellar or pineal regions (16,14). They are usually seen in children or young adults. These patients commonly have diabetes insipidus as one of the presenting complaints, and this reflects the involvement of the hypothalamus and pituitary stalk. Characteristic imaging appearances are those of a homogeneous, solidly enhancing mass involving the hypothalamic region with involvement of the upper aspect of the pituitary stalk (Figs 29 and 30) If the lesions are large then the optic chiasm may be also involved. Involvement in both the suprasellar region and the pineal region at the time of presentation is well recognized (16) (Fig 29). Detection of tumor markers, either human chorionic gonadotrophin (HCG) or alpha fetoprotein (AFP) can be detected in the serum/CSF to confirm the diagnosis (16), and may obviate the need for biopsy. The absence of these markers does not exclude the diagnosis and biopsy may be necessary. Dramatic resolution of the imaging findings after treatment can be seen as these tumors are very sensitive to radiation. These tumors can disseminate through the CSF spaces producing enhancement around the ventricular margins.

Figure 29.
Sagittal T1 weighted enhanced images of a germinoma. Figure demonstrates a large homogeneously enhancing soft tissue mass within the suprasellar region involving the upper aspect of the pituitary stalk and the hypothalamic region with a second separate mass visible in the region of the pineal gland - this is typical of a germinoma.
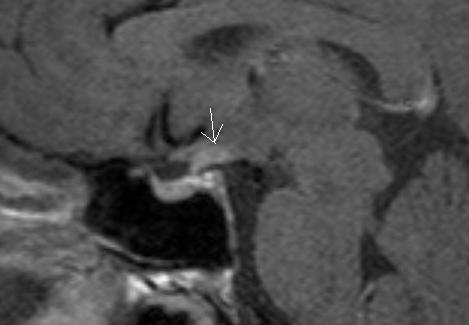
Figure 30.
Sagittal T1 weighted enhanced images of a germinomas. Figure demonstrates a small lesion in the region of the upper aspect of the stalk and hypothalamus (arrow).
GRANULAR CELL TUMORS
Granular cell tumors are rare, benign WHO grade 1 lesions most typically seen in the suprasellar region. They arise from the neurohypophysis and/or the pituitary stalk. They have also been known as choristomas (17) .Histologically, they appear to arise from the pituicyte which is the main posterior pituitary cell. These are seen as well-defined suprasellar masses related to the pituitary stalk with homogeneous enhancement (Fig 31) (17). Despite their intimate relationship to the pituitary stalk, diabetes insipidus is not usually present although other endocrine disturbance may be present and these lesions may even be asymptomatic. If they have reached significant size, they may be associated with visual disturbance or headache. They are benign and slow growing with a low recurrence rate after surgery. Similar in appearance to the granular cell tumor, and equally rare, are the so called pituicytoma and the spindle cell oncocytoma. It seems that histologically these 3 entities show morphological overlap and may arise from a common lineage: they cannot be distinguished on imaging appearances (18).

Figure 31.
Sagittal enhanced T1 weighted image shows a well-defined enhancing mass within the pituitary stalk. The pituitary gland is normal, as is the hypothalamus. This was a granular cell tumor.
LANGERHANS CELL HISTIOCYTOSIS
This is a rare disease of childhood due to a proliferative disorder of the Langerhans cell of the dendritic cell line; CNS involvement is common but it is rarely the only site involved, skeletal involvement being the most frequent (19). A common location for intracranial involvement is the hypothalamo-pituitary axis. The MRI appearances characteristically show thickening of the pituitary stalk with enhancement (Fig 32). The posterior pituitary bright spot is usually absent. These appearances correlate with the typical clinical presentation of diabetes insipidus. This is often an isolated intracranial abnormality but extra-axial/osseous intracranial mass lesions and degenerative changes in the cerebellum and basal ganglia are also recognized (19).

Figure 32.
Sagittal T1 enhanced image shows diffuse thickening of the pituitary stalk in a patient with Langerhans cell histiocytosis.
HYPOPHYSITIS
Hypophysitis is an inflammatory disorder of the pituitary gland which can be primary or secondary to a known infection or systemic disease. Primary hypophysitis includes autoimmune hypophysitis and other inflammatory forms of unknown cause. Distinct histopathological types are recognized; lymphocytic hypophysitis, granulomatous hypophysitis and xanthomatous hypophysitis (20). Lymphocytic and granulomatous hypophysitis have similar indistinguishable MR imaging features: enlargement of the gland producing the appearance of a sellar mass lesion with suprasellar involvement of the stalk (Figs 33 and 34). The gland may appear heterogeneous after contrast and there may be distortion of the chiasm if the suprasellar component is sizeable, which is not uncommon. Lymphocytic hypophysitis is the most common form occurring more often in females and classically presenting at the end of pregnancy or in the post-partum period with endocrine dysfunction (20) There may be also be diabetes insipidus which may correlate with loss of the posterior pituitary bright spot .
A variant of this condition is the so-called lymphocytic infundibulo-neurohypophysitis where the inflammatory process selectively involves the pituitary stalk and the posterior pituitary tissue, and imaging reflects that showing enlargement of the posterior gland and stalk (21).

Figure 33.
Sagittal T1 weighted enhanced image of lymphocytic hypophysitis. There is slight enlargement and heterogeneity of the gland with thickening of the lower part of the stalk. The fossa is not enlarged.

Figure 34.
Coronal T1 weighted enhanced image of lymphocytic hypophysitis. There is slight enlargement and heterogeneity of the gland with thickening of the lower part of the stalk. The fossa is not enlarged.
Secondary hypophysitis can be a reaction to a local process (e.g., infection or cyst rupture) or due to systemic disease, neoplastic processes or drugs. IgG4 plasma cell hypophysitis (22) and hypophysitis caused by the immune checkpoint inhibitors (ICPi) used in oncology (23) are now well described.
The cytotoxic T-lymphocyte-associated protein 4 (CTLA-4) agents (e.g. ipilimumab) and the programmed death 1 (PD-1) agents (e.g. nivolumab) can both cause hypophysitis, but the CTLA-4 agents more frequently do so, and the combination of CTLA-4 and PD-1 carries the highest risk of hypophysitis (23). Ipilimumab-related hypophysitis has been reported in up to 11% of patients and is commoner in men (24). ICPi-related hypophysitis usually occurs within several weeks to months of starting therapy and manifests with headache, fatigue and anterior pituitary hormonal deficiency. Diabetes Insipidus is very rare (23).
MR typically shows a diffuse enlargement of the gland (more rarely the stalk or the gland plus stalk) which regresses after discontinuation of treatment. Enlargement that involves the chiasm is rare (21). Pituitary function may not recover despite the imaging normalization (Fig 35). As many as 23% of cases may have a normal MR despite clinical evidence of drug-induced hypophysitis (25).

Figure 35.
Coronal T1 weighted enhanced image of ipilimumab-induced hypophysitis show diffuse enlargement of the gland with slightly heterogenous enhancement.
IgG4 related hypophysitis is one manifestation of IgG4 related disease. In around 40% of cases it may be an isolated manifestation, but in the majority of cases there is multi-organ involvement, most commonly lung or retroperitoneum (26). Clinical symptoms can relate to the sella mass effects, central diabetic insipidus, or anterior hypopituitarism. In distinction to drug-related hypophysitis, there is a high incidence of diabetes insipidus. A recent case series of 76 cases (26) identified a pituitary mass in 22.4%, a thickened stalk in 26.3%, while 51.3% had both a pituitary mass and a thickened stalk. As it is a fibro-inflammatory process the involved pituitary/ stalk may show low T2W signal (Figs 36 and 37).
A paraneoplastic syndrome with Anti-Pit 1 antibodies is a recognized cause of hypophysitis (with no specific radiological feature from other causes of hypophysitis). Systemic disease such as Granulomatosis with polyangiitis can occasionally involve the pituitary gland, the low T2 signal seen in IgG4 disease (Fig 37) would also be a feature of this type of granulomatous involvement.

Figure 36.
Sagittal enhanced T1 weighted image shows a diffusely enlarged gland and enlarged stalk, of low T2 signal -see Fig 37- due to IgG4 hypophysitis.
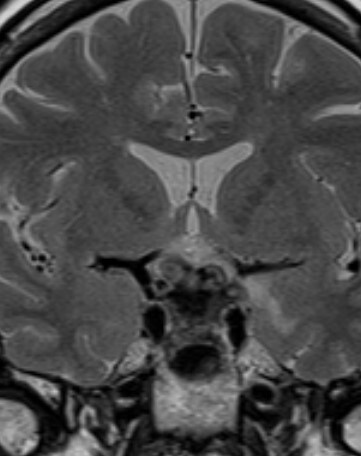
Figure 37.
Coronal T2 weighted image shows a diffusely enlarged gland and enlarged stalk, of low T2 signal due to IgG4 hypophysitis.
All forms of hypophysitis can ultimately result in hypopituitarism with a small volume pituitary gland on imaging (Figs 38 and 39).
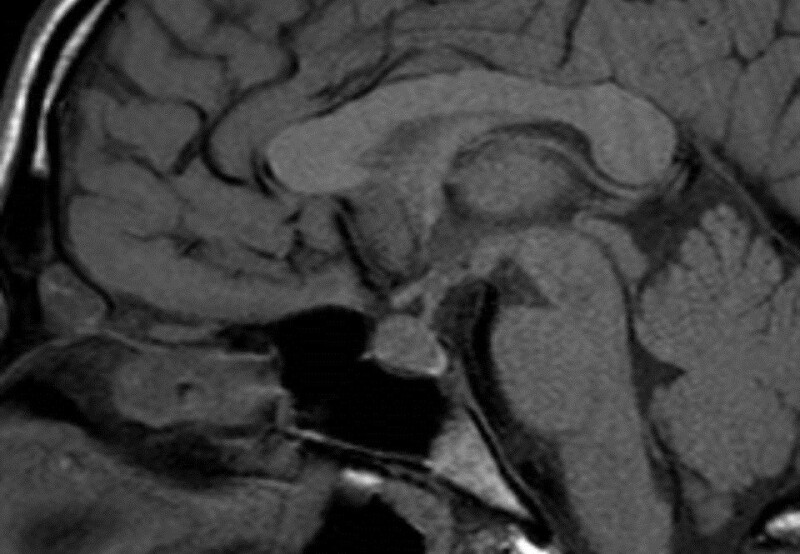
Figure 38.
Sagittal enhanced T1 weighted images show a diffusely enlarged gland and enlarged stalk due to hypophysitis.

Figure 39.
Sagittal enhanced T1 one year after hypophysitis has resulted in a small volume pituitary gland.
Granulomatous hypophysitis is less common and is found equally in males and females. MR appearances are the same as those described for lymphocytic hypophysitis (20).
Xanthomatous hypophysitis is the least common form and is characterized by a distinctly cystic appearance on imaging. An intrasellar cyst without suprasellar extension or involvement of the stalk is the most recognized appearance (20).
THE EMPTY SELLA
An empty sella contains only CSF without any visible pituitary tissue (anterior or posterior). The pituitary stalk will be visible and typically extends down to the floor of the sella (Figs 40 and 41). An empty sella may be the result of previously documented pituitary/hypothalamic pathology or treatment (e.g., surgery, radiotherapy, hypophysitis, Sheehan’s syndrome or pituitary apoplexy). However, it may also be discovered incidentally during MR scanning or in the course of investigating a new endocrine problem, then referred to as a “primary empty sella” (27). A partially empty sella implies that some residual pituitary tissue can still be seen along the floor of the fossa. In the case of a primary empty sella it is thought that a defect in the diaphragma sella (the sheet of dura over the surface of the sella through which the stalk passes) has allowed increased communication with the pulsatile CSF in the subarachnoid space. Primary empty sella is more common in women and has been associated with intracranial hypertension, obesity, visual disturbance, and spontaneous CSF leaks. Endocrine problems may be seen in up to 25% of cases with a primary empty sella (27), the majority within this group being specifically investigated for a suspected endocrine abnormality. However, a small proportion of patients found to have an empty sella unexpectedly may have endocrine abnormalities on detailed testing.

Figure 40.
Sagittal enhanced T1 weighted image shows an empty sella. No pituitary tissue is visible, and the stalk extends down to the floor of the sella. The optic chiasm has prolapsed inferiorly, a not uncommon appearance after a large mass has been removed.

Figure 41.
Coronal enhanced T1 weighted image shows an empty sella. No pituitary tissue is visible, and the stalk extends down to the floor of the sella. The optic chiasm has prolapsed inferiorly, a not uncommon appearance after a large mass has been removed.
ARACHNOID CYSTS
Arachnoid cysts are benign, congenital CSF-containing cysts that arise within the arachnoid membrane. They can be found in the suprasellar region where they may displace and distort the chiasm and stalk and/or flatten the pituitary tissue (Figs 42 and 43). They will always show the same signal as CSF on all MR imaging sequences, do not show any enhancement after contrast, and do not calcify.

Figure 42.
Sagittal unenhanced T1 weighted image shows an arachnoid cyst in the suprasellar region. This is markedly elevating the hypothalamus and stretching the pituitary stalk.
Figure 43.
Coronal unenhanced T1 weighted images show an arachnoid cyst in the suprasellar region with elevation of the right side of the chiasm by the cyst. No cyst wall is evident and the pituitary tissue itself is normal.
CONGENITAL PITUITARY ABNORMALITIES
Congenital hypopituitarism can manifest as isolated growth hormone deficiency (IGHD) or combined pituitary hormone deficiency (CPHD), which can be related to anatomical abnormalities of the hypothalamic/pituitary structures on MR imaging. Imaging features include an ectopic location to the posterior pituitary which is seen to be undescended and is visible as a high signal area in the region of the median eminence (Fig 44). There may be absence of the pituitary stalk and/or hypoplasia of the anterior pituitary tissue. Other congenital abnormalities of midline structures may be associated with these hypothalamic/pituitary features: optic nerve hypoplasia, absence of the septum pellucidum, and corpus callosum abnormalities (28). CPHD is more often associated with callosal and stalk abnormalities than the milder forms of hypopituitarism such as IGHD (28). There are many genetic associations with both IGHD and CPHD, covered in detail in other sections.

Figure 44.
Sagittal T1 weighted unenhanced image. This demonstrates a small pituitary fossa containing a reduced volume of anterior pituitary tissue. The stalk cannot be seen and the posterior pituitary bright spot (arrow) is lying in an ectopic location within the hypothalamus.
An incidental but uncommon imaging finding is that of a lipoma in the suprasellar cistern (Fig 45). This is identified as an entirely high T1 signal mass adjacent to normal hypothalamic and pituitary structures. The fatty nature of the mass can be confirmed with a fat-saturation sequence which will obliterate the signal from the mass.

Figure 45.
Sagittal T1 weighted unenhanced image. There is a high signal mass lying just below the hypothalamus and behind the pituitary stalk in the suprasellar cistern. This is a lipoma. The pituitary tissue and stalk are normal.
HYPOTHALMIC HAMARTOMAS
These are benign developmental mass lesions that arise in the tuber cinereum of the hypothalamus and can be associated with central precocious puberty, gelastic (laughing) seizures, and sometimes developmental delay. The lesions are easily identified on MR imaging as they have a distinctive appearance as an almost pedunculated rounded mass hanging from the hypothalamus. They are of similar signal to the grey matter of the brain and do not show enhancement after contrast injection (Fig 46). Histologically, they are composed of well differentiated neurons and glial cells. They are sometimes approached surgically if the epilepsy is proving refractory to treatment.
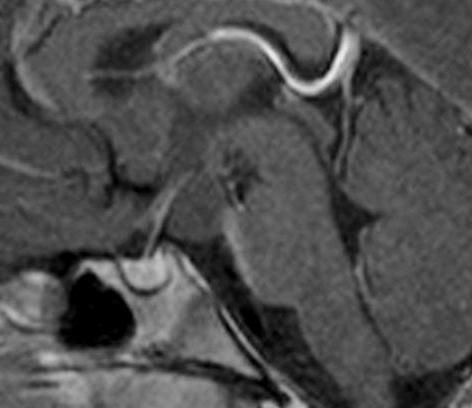
Figure 46.
Sagittal T1 weighted enhanced image of a hypothalamic hamartoma. There is a non-enhancing mass visible arising from the under surface of the hypothalamus and lying behind the pituitary stalk.
SARCOID
CNS involvement is seen in about 25% of cases of sarcoid (29) but many of these are subclinical. Neurosarcoid has a wide spectrum of intracranial imaging appearances including high T2 lesions in the white matter, meningioma-like dural masses, optic nerve lesions, and leptomeningeal enhancement (30). Involvement of the pituitary stalk/hypothalamus is one manifestation and may be part of more widespread leptomeningeal enhancement or may be isolated (Figs 47 and 48). If there is widespread leptomeningeal enhancement then appearances may be indistinguishable from TB meningitis (30)

Figure 47.
Sagittal T1 weighted enhanced images show thickening of the pituitary stalk and nodular enhancement of the right side of the chiasm in a patient with neurosarcoid.
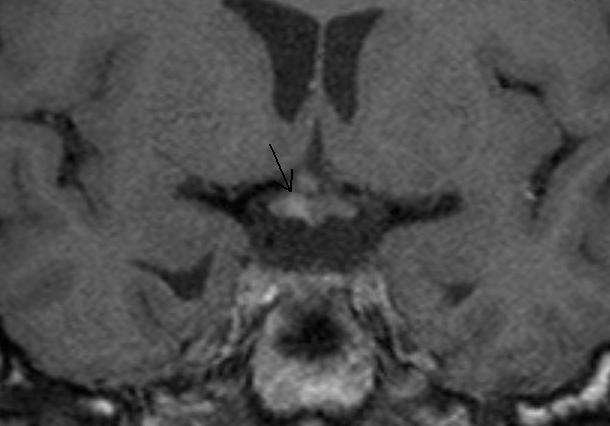
Figure 48.
Coronal T1 weighted enhanced images show thickening of the pituitary stalk and nodular enhancement of the right side of the chiasm in a patient with neurosarcoid.
SKULL BASE TUMORS
Tumors of the central skull base may involve the sella or parasellar region and are in the differential diagnosis of any large mass around the sella which has significant bony involvement. Primary tumors occurring in this region are the chordoma and the chondrosarcoma (14) Chordomas arise from remnants of the primitive notochord and are seen as well-defined, centrally-located, expansile masses arising from the clivus. They show distinctive high signal on T2 weighted images and bony destruction on CT (Fig 49). Chondrosarcomas (malignant mesenchymal tumors) have a similar appearance but tend to arise just lateral to the clivus at the site of the petroclival synchondrosis (Fig 50 and 51); however, it is often not possible to distinguish between these two tumor types radiologically (31). Any destructive bony malignancy such as metastatic disease or plasmacytoma may involve the central skull base.
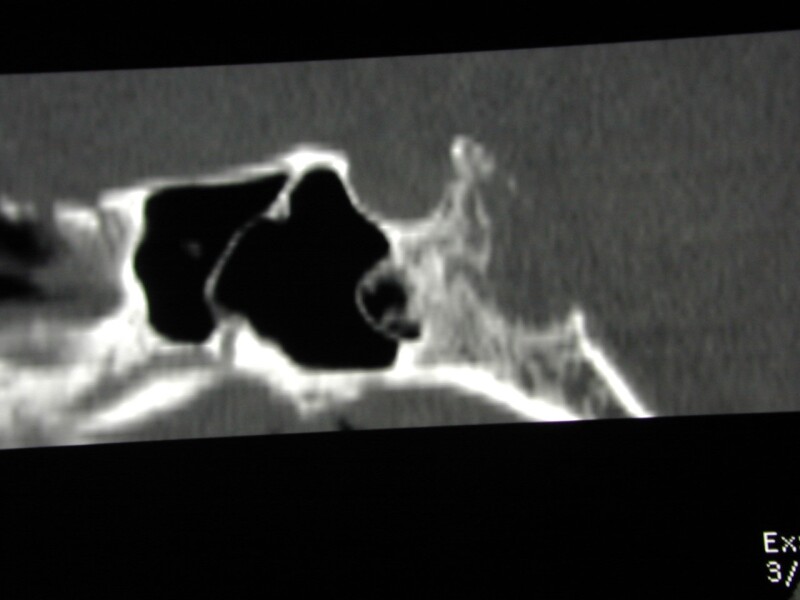
Figure 49.
Sagittal CT reconstruction shows a destructive bony lesion in the clivus – a chordoma, the sella itself is preserved.
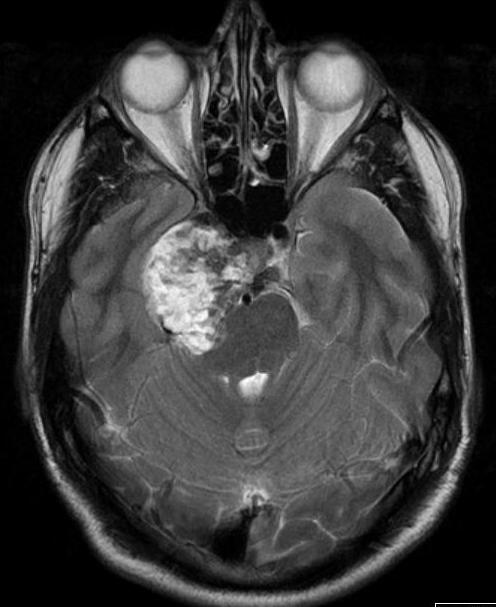
Figure 50.
Axial T2 image of a chondrosarcoma. This shows the typical bubbly high T2 signal and involves the right side of the pituitary fossa, the right cavernous sinus and extends into the right middle cranial fossa.

Figure 51.
Axial-enhanced T1 weighted image of a chondrosarcoma. This shows the typical bubbly high T2 signal and involves the right side of the pituitary fossa, the right cavernous sinus and extends into the right middle cranial fossa.
ECCHORDOSIS PHYSALIPHORA
Ecchordosis physaliphora is a benign, congenital, hamartomatous notochord remnant usually found in the retroclival region. They are typically small, asymptomatic and can be found in up to 2% of autopsies.
They are histologically identical to chordomas, which are typically sizeable and present with brainstem or cranial nerve compression.
On MR imaging they lie in the retroclival, prepontine region, are similar signal to CSF, notably high signal on T2 sequences (Fig 52) and show variable (usually none to little) enhancement. CT classically shows a well-defined, non-aggressive clival bony defect. A bony stalk may be seen, and this is considered pathognomonic (Fig 53). Although previously considered a distinct clinical entity they are now considered to lie at the benign end of a pathological spectrum that extends to chordomas (32).
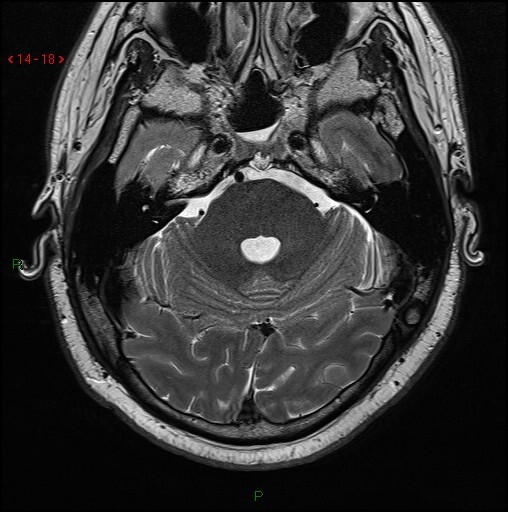
Fig 52.
Axial T2 volumetric scan shows a small nodule of T2 hyperintense tissue extending through a well-defined midline bony defect in the clivus (arrow).
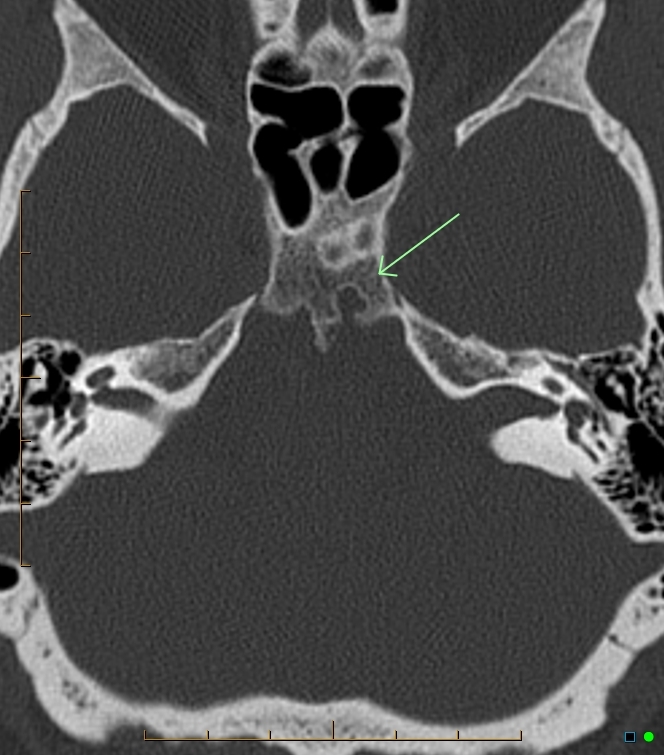
Fig 53.
Axial CT of the skull base shows a well-defined cortical defect (arrow) in the clivus with a small bony spur just to the Rt of the defect (not the same case as image 51).
METASTASES
Metastatic spread of systemic tumors to the pituitary gland/stalk is relatively uncommon and is usually seen in the context of diffuse malignancy. Breast and lung are the commonest primary tumors to do this although other primary tumors have been reported in the literature (33,14). A clinical presentation with diabetes insipidus reflects the involvement of the stalk in many cases. Diffuse enlargement of the gland with thickening of the stalk (Fig 54) in a patient with known malignancy might suggest this diagnosis.

Figure 54.
Coronal enhanced T1 weighted image shows a diffusely enlarged pituitary gland with bilateral enlargement of both cavernous sinuses and some thickening of the stalk, this was metastatic disease in a patient with breast carcinoma.
REFERENCES
- 1.
- Dietrich RB, Lis LE, Greensite FS, Pitt D. Normal MR appearance of the pituitary gland in the first 2 years of life. Am J Neuroradiol 1995;16:1413-1419 [PMC free article: PMC8338052] [PubMed: 7484625]
- 2.
- Tsunoda A, Okuda O, Sato K. MR height of the pituitary gland as a function of age and sex: especially physiological hypertrophy in adolescence and in climacterium. Am J Neuroradiol 1997;18:551-554 [PMC free article: PMC8338404] [PubMed: 9090422]
- 3.
- Dinc H, Esen F, Demirci A, Sari A, Resit Gumele H. Pituitary dimensions and volume measurements in pregnancy and post partum. MR assessment. Acta Radiol 1998;39:64-69 [PubMed: 9498873]
- 4.
- Steiner E, Wimberger D, Imhof H, Knosp E, Hajek P. [Gd-DTPA in the MR diagnosis of pituitary adenomas]. Rofo 1989;150:323-327 [PubMed: 2538883]
- 5.
- Kucharczyk W, Bishop JE, Plewes DB, Keller MA, George S. Detection of pituitary microadenomas: comparison of dynamic keyhole fast spin-echo, unenhanced, and conventional contrast-enhanced MR imaging. Am J Roentgenol 1994;163:671-679 [PubMed: 8079866]
- 6.
- Knosp E, Steiner E, Kitz K, Matula C. Pituitary adenomas with invasion of the cavernous sinus space: a magnetic resonance imaging classification compared with surgical findings. Neurosurgery 1993;33:610-617; discussion 617-618 [PubMed: 8232800]
- 7.
- Kucharczyk W, Davis DO, Kelly WM, Sze G, Norman D, Newton TH. Pituitary adenomas: high-resolution MR imaging at 1.5 T. Radiology 1986;161:761-765 [PubMed: 3786729]
- 8.
- Ahmadi H, Larsson EM, Jinkins JR. Normal pituitary gland: coronal MR imaging of infundibular tilt. Radiology 1990;177:389-392 [PubMed: 2217774]
- 9.
- Patronas N, Bulakbasi N, Stratakis CA, Lafferty A, Oldfield EH, Doppman J, Nieman LK. Spoiled gradient recalled acquisition in the steady state technique is superior to conventional postcontrast spin echo technique for magnetic resonance imaging detection of adrenocorticotropin-secreting pituitary tumors. J Clin Endocrinol Metab 2003;88:1565-1569 [PubMed: 12679440]
- 10.
- Chatain GP, Patronas N, Smirniotopoulos JG, Piazza M, Benzo S, Ray-Chaudhury A, Sharma S, Lodish M, Nieman L, Stratakis CA, Chittiboina P. Potential utility of FLAIR in MRI-negative Cushing's disease. J Neurosurg 2018;129:620-628 [PMC free article: PMC6398169] [PubMed: 29027863]
- 11.
- Heck A, Ringstad G, Fougner SL, Casar-Borota O, Nome T, Ramm-Pettersen J, Bollerslev J. Intensity of pituitary adenoma on T2-weighted magnetic resonance imaging predicts the response to octreotide treatment in newly diagnosed acromegaly. Clin Endocrinol (Oxf) 2012;77:72-78 [PubMed: 22066905]
- 12.
- Kremer P, Forsting M, Ranaei G, Wuster C, Hamer J, Sartor K, Kunze S. Magnetic resonance imaging after transsphenoidal surgery of clinically non-functional pituitary macroadenomas and its impact on detecting residual adenoma. Acta Neurochir (Wien) 2002;144:433-443 [PubMed: 12111499]
- 13.
- Teramoto A, Hirakawa K, Sanno N, Osamura Y. Incidental pituitary lesions in 1,000 unselected autopsy specimens. Radiology 1994;193:161-164 [PubMed: 8090885]
- 14.
- Kaltsas GA, Evanson J, Chrisoulidou A, Grossman AB. The diagnosis and management of parasellar tumours of the pituitary. Endocr Relat Cancer 2008;15:885-903 [PubMed: 18809592]
- 15.
- Sartoretti-Schefer S, Wichmann W, Aguzzi A, Valavanis A. MR differentiation of adamantinous and squamous-papillary craniopharyngiomas. Am J Neuroradiol 1997;18:77-87 [PMC free article: PMC8337875] [PubMed: 9010523]
- 16.
- Packer RJ, Cohen BH, Cooney K. Intracranial germ cell tumors. Oncologist 2000;5:312-320 [PubMed: 10964999]
- 17.
- Cohen-Gadol AA, Pichelmann MA, Link MJ, Scheithauer BW, Krecke KN, Young WF, Jr., Hardy J, Giannini C. Granular cell tumor of the sellar and suprasellar region: clinicopathologic study of 11 cases and literature review. Mayo Clin Proc 2003;78:567-573 [PubMed: 12744543]
- 18.
- Mete O, Lopes MB, Asa SL. Spindle cell oncocytomas and granular cell tumors of the pituitary are variants of pituicytoma. The American journal of surgical pathology 2013;37:1694-1699 [PubMed: 23887161]
- 19.
- D'Ambrosio N, Soohoo S, Warshall C, Johnson A, Karimi S. Craniofacial and intracranial manifestations of langerhans cell histiocytosis: report of findings in 100 patients. Am J Roentgenol 2008;191:589-597 [PubMed: 18647937]
- 20.
- Gutenberg A, Hans V, Puchner MJ, Kreutzer J, Bruck W, Caturegli P, Buchfelder M. Primary hypophysitis: clinical-pathological correlations. Eur J Endocrinol 2006;155:101-107 [PubMed: 16793955]
- 21.
- Abe T. Lymphocytic infundibulo-neurohypophysitis and infundibulo-panhypophysitis regarded as lymphocytic hypophysitis variant. Brain Tumor Pathol 2008;25:59-66 [PubMed: 18987830]
- 22.
- Hsing MT, Hsu HT, Cheng CY, Chen CM. IgG4-related hypophysitis presenting as a pituitary adenoma with systemic disease. Asian journal of surgery / Asian Surgical Association 2013;36:93-97 [PubMed: 23522762]
- 23.
- Chang LS, Barroso-Sousa R, Tolaney SM, Hodi FS, Kaiser UB, Min L. Endocrine Toxicity of Cancer Immunotherapy Targeting Immune Checkpoints. Endocr Rev 2019;40:17-65 [PMC free article: PMC6270990] [PubMed: 30184160]
- 24.
- Faje AT, Sullivan R, Lawrence D, Tritos NA, Fadden R, Klibanski A, Nachtigall L. Ipilimumab-induced hypophysitis: a detailed longitudinal analysis in a large cohort of patients with metastatic melanoma. J Clin Endocrinol Metab 2014;99:4078-4085 [PubMed: 25078147]
- 25.
- Caturegli P, Di Dalmazi G, Lombardi M, Grosso F, Larman HB, Larman T, Taverna G, Cosottini M, Lupi I. Hypophysitis Secondary to Cytotoxic T-Lymphocyte-Associated Protein 4 Blockade: Insights into Pathogenesis from an Autopsy Series. Am J Pathol 2016;186:3225-3235 [PMC free article: PMC5225294] [PubMed: 27750046]
- 26.
- Li Y, Gao H, Li Z, Zhang X, Ding Y, Li F. Clinical Characteristics of 76 Patients with IgG4-Related Hypophysitis: A Systematic Literature Review. Int J Endocrinol 2019;2019:5382640 [PMC free article: PMC6935800] [PubMed: 31929792]
- 27.
- Del Monte P, Foppiani L, Cafferata C, Marugo A, Bernasconi D. Primary "empty sella" in adults: endocrine findings. Endocr J 2006;53:803-809 [PubMed: 16983177]
- 28.
- Mehta A, Hindmarsh PC, Mehta H, Turton JP, Russell-Eggitt I, Taylor D, Chong WK, Dattani MT. Congenital hypopituitarism: clinical, molecular and neuroradiological correlates. Clin Endocrinol (Oxf) 2009;71:376-382 [PubMed: 19320653]
- 29.
- Pawate S, Moses H, Sriram S. Presentations and outcomes of neurosarcoidosis: a study of 54 cases. QJM 2009;102:449-460 [PubMed: 19383611]
- 30.
- Lexa FJ, Grossman RI. MR of sarcoidosis in the head and spine: spectrum of manifestations and radiographic response to steroid therapy. Am J Neuroradiol 1994;15:973-982 [PMC free article: PMC8332168] [PubMed: 8059671]
- 31.
- Almefty K, Pravdenkova S, Colli BO, Al-Mefty O, Gokden M. Chordoma and chondrosarcoma: similar, but quite different, skull base tumors. Cancer 2007;110:2457-2467 [PubMed: 17894390]
- 32.
- Stevens AR, Branstetter BFt, Gardner P, Pearce TM, Zenonos GA, Arani K. Ecchordosis Physaliphora: Does It Even Exist? Am J Neuroradiol 2023;44:889-893 [PMC free article: PMC10411852] [PubMed: 37442592]
- 33.
- Komninos J, Vlassopoulou V, Protopapa D, Korfias S, Kontogeorgos G, Sakas DE, Thalassinos NC. Tumors metastatic to the pituitary gland: case report and literature review. J Clin Endocrinol Metab 2004;89:574-580 [PubMed: 14764764]
- ABSTRACT
- ANATOMY AND EMBRYOLOGY
- MR IMAGING
- PITUITARY ADENOMAS
- RATHKE’S CLEFT CYSTS
- MENINGIOMAS
- CRANIOPHARYNGIOMAS
- HYPOTHALAMIC/OPTIC CHIASM GLIOMAS
- GERMINOMA
- GRANULAR CELL TUMORS
- LANGERHANS CELL HISTIOCYTOSIS
- HYPOPHYSITIS
- THE EMPTY SELLA
- ARACHNOID CYSTS
- CONGENITAL PITUITARY ABNORMALITIES
- HYPOTHALMIC HAMARTOMAS
- SARCOID
- SKULL BASE TUMORS
- ECCHORDOSIS PHYSALIPHORA
- METASTASES
- REFERENCES
- Review Pathology And Pathogenesis Of Pituitary Adenomas And Other Sellar Lesions.[Endotext. 2000]Review Pathology And Pathogenesis Of Pituitary Adenomas And Other Sellar Lesions.Larkin S, Ansorge O. Endotext. 2000
- Review Hypophysitis.[Endotext. 2000]Review Hypophysitis.Prete A, Salvatori R. Endotext. 2000
- Review Imaging findings in hypophysitis: a review.[Radiol Med. 2020]Review Imaging findings in hypophysitis: a review.Caranci F, Leone G, Ponsiglione A, Muto M, Tortora F, Muto M, Cirillo S, Brunese L, Cerase A. Radiol Med. 2020 Mar; 125(3):319-328. Epub 2019 Dec 20.
- Thickened pituitary stalk on MR images in patients with diabetes insipidus and Langerhans cell histiocytosis.[AJNR Am J Neuroradiol. 1990]Thickened pituitary stalk on MR images in patients with diabetes insipidus and Langerhans cell histiocytosis.Tien RD, Newton TH, McDermott MW, Dillon WP, Kucharczyk J. AJNR Am J Neuroradiol. 1990 Jul-Aug; 11(4):703-8.
- Review Diabetes insipidus secondary to sellar/parasellar lesions.[J Neuroendocrinol. 2021]Review Diabetes insipidus secondary to sellar/parasellar lesions.Angelousi A, Mytareli C, Xekouki P, Kassi E, Barkas K, Grossman A, Kaltsas G. J Neuroendocrinol. 2021 Mar; 33(3):e12954.
- Radiology of the Pituitary - EndotextRadiology of the Pituitary - Endotext
Your browsing activity is empty.
Activity recording is turned off.
See more...