

NCBI Bookshelf. A service of the National Library of Medicine, National Institutes of Health.
Probe Reports from the NIH Molecular Libraries Program [Internet]. Bethesda (MD): National Center for Biotechnology Information (US); 2010-.
Recent findings have shown that KCC2, a neuronal-specific potassium-chloride (K-Cl) Cotransporter, modulates inhibitory neurotransmission in the CNS and spinal cord. Loss of function of this cotransporter within selective regions of the nervous system has been linked to the potential development of neuropathic pain. This project proposed to identify small molecule ligands (both agonists and antagonists) of the neuronal KCC2 Cotransporter that are cell permeable, exhibit submicromolar potency, and show greater than 10-fold selectivity over other closely related NKCC transporters. This probe report describes ML077 (CID-25067404), a highly selective, potent, saline soluble, "best in class" KCC2 antagonist for high fidelity in vitro studies on KCC2 function.
Assigned Assay Grant #: R21 NS53658
Screening Center Name & PI: Vanderbilt Specialized Screening for GPCRs, Ion Channels and Transporters, David Weaver
Chemistry Center Name & PI: Vanderbilt Specialized Chemistry Center for Accelerated Probe Development, Craig Lindsley
Assay Submitter & Institution: Eric Delpire, Vanderbilt University
PubChem Summary Bioassay Identifier (AID): AID-1799
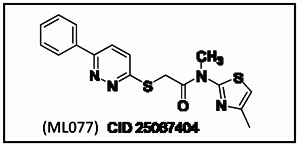
Probe Structure & Characteristics
N-methyl-N-(4-methylthiazol-2-yl)-2-(6-phenylpyridazin-3-ylthio)acetamide
| CID | Target Name | IC50/EC50 (nM) [SID, AID] | Anti-target Name(s) | IC50/EC50 (μM) [SID, AID] | Selectivity | Secondary Assay(s) Name: IC50/EC50 (nM) [SID, AID] |
|---|---|---|---|---|---|---|
| 25067404 (ML077) | KCC2 | 537 [SID-56405461, AID-1456, AID-1793, AID-1717, AID-1735, AID-1738, AID-1737] | NKCC1 | >>50 μM [SID-56405461, AID-1716, AID-1718, AID-1713, AID-1715, AID-1723, AID-1714, AID-1753] | >100-fold | 537 nM Rb Flux KCC2 [SID-56405461, AID-1734] |
Recommendations for the scientific use of this probe
This is the most potent, and the only selective KCC2 antagonist ever described. CID 25067404 (ML077) is a highly selective KCC2 antagonist versus NKCC1 and a panel of 68 GPCRs, ion channels and transporters (no inhibition >50% at 10 μM). Thus, this probe can used in vitro to study KCC2 function with confidence.
Specific Aim
To identify small molecule ligands (both agonists and antagonists) of the neuronal K-Cl cotransporter KCC2. Desired ligands would be cell permeable, exhibit submicromolar potency, and show greater than 10 fold selectivity over other other closely related NKCC transporters. This probe report describes a potent, highly selective KCC2 antagonist (CID 25067404 (ML077), SID-56405461) that inhibits KCC2. The probe is ‘best in class’ providing unprecedented potency and selectivity at KCC2, clean ancillary pharmacology, and soluble in saline (~10 mg/mL).
Significance and Rationale
Cells possess in their plasma membranes proteins that tightly couple the movement of inorganic cations such as Na+ and K+, together with Cl−. The Slc12 cation-chloride cotransporter family consists of two loop diuretic-sensitive Na-K-2Cl cotransporters (NKCC1 and NKCC2), one thiazide-sensitive Na-Cl cotransporter, and four Na+-independent K-Cl cotransporters: KCC1-KCC4. These seven transport mechanisms play key roles in a variety of physiological processes: fluid and salt reabsorption in kidney; fluid and salt secretion in inner ear, Cl-secreting epithelia such as salivary-, sweat-, and lacrimal glands, lung airway epithelium, and intestine; control of neuronal excitability; and control and maintenance of cell volume (for reviews, see (1–3)). Their disruption causes salt wasting disorders (4, 5), alteration of blood pressure (6, 7), hyperexcitability (8, 9), nerve degeneration (10), and alteration of cell proliferation and invasiveness (11).
The cation-chloride cotransporters have received much attention in the past decade for the role they play in the nervous system. In particular KCC2, a neuronal-specific K-Cl cotransporter, has been shown to modulate inhibitory neurotransmission both in the brain and in the spinal cord. By reducing the intracellular Cl− concentration below its thermodynamic equilibrium potential in central neurons, KCC2, strengthens synaptic inhibition. Several studies have shown that loss of KCC2 function in central neurons results in the development of CNS hyperexcitability (8, 12, 13). Moreover, a paper from Coull and coworkers also showed that disinhibition in the dorsal horn of the spinal cord triggered by peripheral nerve injury was mediated by a significant decrease in KCC2 expression (14). Local blockade or knock-down of spinal KCC2 in intact rats markedly reduced the nociceptive threshold. By linking change in KCC2 function to disruption of Cl− homeostasis in lamina I neurons, the study clearly linked the loss of KCC2 function to a loss of inhibition in this region of the spinal cord and to an increase in chronic pain. The relationship between KCC2 and nerve or spinal cord injury has been confirmed in subsequent studies that have shown that inflammatory response due to intraplantar injection of formalin (15, 16) or hind paw injection of complete Freund’s adjuvant (17), or to loose ligation of the sciatic nerve (18), or contusive spinal cord injury at T9 (19), all led to a down-regulation of cotransporter expression. Altogether, these studies also point to a role of KCC2 in neuropathic pain.
The pharmacology of the cation-chloride cotransporters is dominated by two classes of drugs: the thiazide and loop diuretics (Figure 1). Whereas thiazide diuretics target the apical Na-Cl cotransporter, located in the distal convoluted tubule, resulting in decreased salt reabsorption, loop diuretics (furosemide or LASIX and bumetanide or BUMEX), as their names imply, inhibit the apical Na-K-2Cl cotransporter, NKCC2, located in the thick ascending loop of Henle, thereby diminishing kidney salt reabsorption. They also inhibit NKCC1 in the micromolar range in isolated cells, but have little effect on NKCC1 in situ due to their binding to albumin in the circulation and consequently their poor access to peripheral tissues. High doses of diuretics have, however, ototoxic effects due to inhibition of NKCC1 in the inner ear (20–22). Furosemide 1 and bumetanide 2 also inhibit K-Cl cotransporter, including KCC2 but at much higher concentrations (500 μM-1 mM) and are pan transporter inhibitors (23–25). There are two compounds that inhibit K-Cl cotransport in the micomolar range: DIDS 3 and DIOA 4, but their effect is species-specific (26, 27) and lacking specificity with regard to other ion transporters and channels (for reviews, see (28, 29)). To identify novel molecules that affect the activity of KCC2, we developed a novel fluorescence-based method appropriate for high throughput screening. Indeed, all traditional methods used to assess cation-chloride cotransporter activity are not adequate for HTS. The method makes use of a fluorescent dye sensitive to thallium, a cation that is transported by cation-chloride cotransporter. Thallium, in combination with dye, was previously used to assay uptakes of K+ though K+ channels (30). Using this method, we screened a library of 234,000 compounds with KCC2 as a target, and identified a number of compounds that affect the activity of the cotransporter.

Figure 1
Known KCC2 Antagonists - Unselective and Weak (micromolar to millimolar IC50s).
Screening center information
Assay Implementation and Screening
PubChem Bioassay Name: Identification of Novel Modulators of Cl-Dependent Transporter Processes via HTS.
List of PubChem bioassay identifiers generated for this screening project (AIDS): AID-1456, AID-1735, AID-1738, AID-1717, AID-1716, AID-1737, AID-1734, AID-1718, AID-1713, AID-1715, AID-1736, AID-1723, AID-1714, AID-1753, AID-1793.
PubChem Primary Assay Description
HEK293 cell culture
Wild-type or KCC2-expressing HEK293 cells were grown up to 80–90% confluence in 10-cm dishes containing Dulbecco’s modified Eagle’s medium/Ham’s F-12 (1:l) (Invitrogen, Carlsbad, CA) supplemented with 10% fetal bovine serum (JRH Biosciences, Lenexa, KS), 50 unit/ml penicillin, and 50 pg/ml streptomycin (Invitrogen). KCC2-expressing clones were under puromycin selection (2 μg/ml, Sigma, St. Louis, MO). Cultures were maintained at 37oC in the presence of 5% CO2. Cells were passaged every 3–4 days, using a ratio of 1:10, for a maximum of 16 passages. For fluorescence measurements, the cells were plated in T175 flasks, 4 days prior to the assay.
KCC2 subcloning
The rat KCC2 cDNA (31) inserted in the Xenopus laevis oocyte expressing pBF (32) was excised using SpeI and BglII restriction enzymes and inserted into the mammalian expression vector pIRESpuro2 at the compatible NheI and BamHI sites (BD Biosciences, San Jose, CA). After transformation into competent E. coli DH5α cells, the DNA was purified (Qiagen, Valencia, CA).
Generation of KCC2 overexpressing clones
HEK293 cells were then plated to reach 60–70% confluence the following day when they were transfected using 7.5 g KCC2- pIRESpuro2 cDNA and 11.3 μl Fugene (Roche Applied Science, Indianapolis, IN). Twenty four hours post-transfection, the cells were subjected to puromycin (2 μg/ml). After 15 days puromycin selection, the cells were trypsinized, counted, and plated in multiple 96 well plates at ~1 cell per well. Using our HTS-compatible functional assay (see below), 48 clones were first selected from 16 x 96-well plates (~1500 clones) and expanded to 24-well plates.
Tl-induced fluozin-2 fluorescence increase
The day prior to the experiment, cells were plated in 384-well, black-walled, clear bottom, poly-D-lysine coated plates (Greiner Bio- One, Monroe, NC) at a concentration of 20,000 cells per well using a Multidrop Combi (Thermo Fisher, Waltham, MA). The medium was removed using an ELx405CW cell washer (BioTek, Winooski, VT) and replaced with 20 μl HBSS + 20 mM HEPES, pH 7.3) and 20 μl of HBSS + 20 mM HEPES, pH 7.3 containing 2 μM fluozin-2 dye (Invitrogen) + 0.2 % (w/v) Pluronic F-127 (Invitrogen) using a Multidrop Combi. Cells were incubated with the dye at room temperature for 48 minutes. The wells were then washed thrice with HBSS + 20 mM HEPES (addition of 80 μl and aspiration to leave ~ 20 μl) using the ELx405CW. After the washes the cell plate was inserted into a Hamamatsu FDSS 6000 (Bridgewater, NJ) and pre- compound addition fluorescence counts were obtained (5 frames at 1 Hz, excitation 470 ± 20 nm, emission 540 ± 30 nm), In parallel, 70 nl/well of compounds from 10 mM (nominal) stocks in DMSO supplied as the Molecular Libraries Small Molecule Repository collection by BioFocus DPI (South San Francisco, CA) were transferred to 384-well polypropylene plates (Greiner) using an Echo 555 (Labcyte, Sunnyvale, CA) and diluted with 35 μl/well HBSS + 20 mM HEPES’ pH 7.3 + 200 μM ouabain using a Multidrop Combi. Twenty microliters/well of the diluted compounds were then added to the dye-loaded cell plates using a Velocity11 Bravo (Santa Clara, CA) and incubated for 8 min. Next, the compound-treated cell plates were loaded back onto the FDSS 6000. After 10 seconds, 10 μl/well of 5X thallium stimulus buffer (125mM sodium bicarbonate, 12mM thallium sulfate, 1mM magnesium sulfate, 1.8mM calcium sulfate, 5mM glucose, 10mM HEPES, pH 7.3) was added. All steps of the screening protocol post-compound plating were accomplished using an automated screening system. Plates were moved using a Thermo Fisher F3 robotic arm and all instruments and scheduling were under the control of Thermo Fisher Polara scheduling software version 2.3. After normalizing each well’s fluorescence trace by dividing each data point post compound addition by the initial fluorescence values obtained on the FDSS pre-compound addition, activity was measured by obtaining the initial values of the slope of Tl+ -stimulated fluorescence increase using linear regression. Hits were selected as compounds that caused a decrease in the slope of >/= 3 standard deviations from the general population of test wells. Hits were reordered from BioFocus DPI and retested in duplicate. Retest positive compounds were further evaluated by testing them at varying concentrations on both the KCC2-expressing cell line and the parental untransfected HEK cells. Compounds displaying selective, concentration dependent activity were selected for further evaluation.
86Rb assays in HEK293 cells
For rubidium uptake assays, cells were briefly trypsinized from 10-cm dishes and plated for 2 hours on 35-mm dishes coated with poly-L-Lysine (0.1 mg/ml, Sigma). Cells were washed once and pre-incubated for 15 min with 1 ml hyposmotic saline solution containing in mM: 120 NaCl, 5 KCl, 2 CaCl2, 0.8 MgSO4, 5 HEPES, 5 glucose, 100 μM ouabain, 500 μM N-ethylmaleimide, pH 7.4 with HCl (260–270 mOsm). After the preincubation period, the medium was aspirated and replaced with 1 ml of similar solution without NEM, but containing 1 μCi/ml 86Rb (Perkin Elmer, Wellesley, MA). After 15 min uptake, the solution was aspirated and the cells were washed thrice with ice-cold solution. Time course experiments have shown that the flux is linear over a 30 min period (not shown). The cells were then lysed for 1 hour with 500 μl 0.25N NaOH and then neutralized with 250 μl glacial acetic acid. A 300 μl aliquot was then added to 5 ml liquid scintillation fluid (Biosafe II, Research Products International, Mt. Prospect, IL) for counting and a 30 μl aliquot was used for protein assay (Bradford: Biorad, Hercules, CA). A 5 μl aliquot of the uptake solution was also counted as standard. Uptakes are expressed in pmole K+/mg protein/min, and the furosemide-sensitive uptake (KCC mediated flux) is calculated as the difference between the uptake measured in absence of furosemide and the flux obtained in the presence of 2 mM furosemide. Each experimental condition is measured in triplicate.
Western blot
For determination of KCC2 expression, HEK293 cells and clones were grown in 60-mm dishes for 3 days and lysed on ice with 350 μl buffer containing 150 mM NaCl, 50 mM Tris-Cl, 2 mM EDTA, 0.1% SDS, 1% CHAPS, 0.5% Na-deoxycholate, and cocktail of protease inhibitors (1 tablet/10 ml Roche Applied Science). After 10 min, the cell debris was scraped and the lysate was recovered and placed in a microcentrifuge tube on ice for 30 min. Next, the lysate was spun at 10,000 rpm for 10 min, the supernatant was recovered, and its protein content was quantified using the Bradford assay (Biorad). Proteins (20 μg/lane) were resolved by 7.5% SDS-PAGE and electroblotted onto polyvinylidene difluoride (PVDF) membranes (Millipore, Billerica, MA). Membranes were blocked for 2 hours at room temperature with 5% non-fat dry milk in TBST (150 mM NaCl, 10 mM Tris HCl, 0.5% Tween 20 [polyoxyethylene-sorbitan monolaurate]), then incubated overnight at 4oC with a C- terminal polyclonal anti-KCC2 antibody (1:1000) in TBST/5% non-fat dry milk (33). Membranes were washed extensively in TBST, and protein bands were visualized by enhanced chemiluminescence (ECL plus, Amersham Biosciences, Piscataway, NJ).
Summary of Screen
The screen was conducted in multiple 384-well plates containing HEK293 cells over-expressing KCC2. For each plate, 4 columns were dedicated to controls: 2 columns (32 wells) using standard HBSS conditions with ouabain and 2 columns using HBSS + 2 mM bumetanide. These wells allowed for internal quality assessment. Each of the remaining 320 wells was dedicated to one compound tested at a concentration of nominally 10 μM. Utilizing 733 plates, we screened 234,560 compounds with an average Z’ value of 0.686 ± 0.090, indicating both high fidelity and good separation between the two control signals (plus and minus bumetanide). Compounds that decreased or stimulated fluorescence signals more than three standard deviations from the test compound population measured on a per-plate basis were counted as primary hits. The screen yielded 4,933 hits (2%) with 1880 compounds reducing and 2954 compounds increasing the fluorescence signal, respectively. We only identified antagonists.
After elimination of duplicates, a secondary screen was performed with 3,695 compounds. Each compound was tested in duplicate at a concentration of 10 μM using both KCC2-overexpressing cells and naïve HEK293 cells. With each cell line, the secondary screen was performed in the presence and absence of ouabain, and 45% of the compounds (2,224) verified. We identified 465 compounds that were positive in KCC2 over-expressing cells, but not in naïve HEK293 cells, irrespective of the presence or absence of ouabain. Each of the 465 compounds was then tested at various concentrations (ranging from 0.5 nM to 30 µM) in triplicate and ~76% of them displayed a typical dose dependence.
Based on their potency and structure, we selected 26 compounds that inhibited thallium-induced fluorescence increase and tested them on KCC2 and NKCC1 functions using 86Rb uptakes in HEK293 cells. For KCC2, we used N-ethylmaleimide pre-treatment in KCC2 over-expressing HEK293 cells. The alkylating agent not only stimulates K-Cl cotransport, but abrogates the function of the native Na-K-2Cl cotransporter. As seen in Figure 3, furosemide inhibits 93% of the uptake at a concentration of 2 mM and had no effect at a concentration below 30 μM. For NKCC1, we used a hyperosmotic solution to stimulate the transporter in naïve HEK293 cells. 86Rb uptake was 95% inhibited by a low dose (20 μM) of bumetanide. Table 1 lists the efficacy of each of the 26 compounds on KCC2 and NKCC1 function. As seen in the table, some compounds like D4 inhibit KCC2 with a measured IC50 in the submicromolar range while minimally affecting NKCC1. In contrast, other compounds like D8 acted equally well on KCC2 and NKCC1.
Supporting Table 1
Inhibition of KCC2 (IC50) and NKCC1 (% at 5 and 50 μM) with various hit compounds.
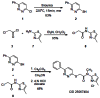
Of the confirmed hits, D4 (KCC2 IC50 = 560 nM) proved to be the most drug-like lead for probe development, and displayed selectivity versus NKCC1 (~19.7% inhibition at 50 μM) – already best in class and meets probe criteria for a KCC2 antagonist. We then resynthesized D4, in a library format, along with 12 new analogs. As shown in Scheme 1, commercial 3-chloro-6-phenylpyridazine 1 was exposed to thiourea under microwave irradiation (220oC, 15 min) to deliver 6- phenylpyridazine-3-thiol 2 in 83% yield. Alpha-chloroacetyl chloride 4 was then treated with 12 different heterocyclic amines 3 to deliver alkylation substrates 5 in yields ranging from 80–95%. Alkylation of 2 with 5 employing CsCO3 in CH3CN provides analogs 6 in yields ranging from 30–52%. This library was then screened for its ability to inhibit KCC2 function at 1 mM with 2 mM bumetanide as a positive control (Figure 2). This series displayed robust, tractable SAR. The parent HTS hit D4 (CID 7211972) repeated, displaying 70% inhibition of KCC2 at 1 μM dose. Other thiazole songeners, with substitution in the 4-position (6i (CID 7211972) and 6k (CID 25067401)), or unsubstituted (6g (CID 25067400)) displayed activity (38–57% at 1 μm). Interestingly, if the methyl substituent was moved to the 5- position, as in 6a (CID 25067400), all KCC2 inhibitory activity was lost. Pyridines, known thiazole mimetics, were weak to moderate KCC2 antagonists. In order to afford a more favorable ancillary profile, we also prepared within the library a tertiary amide analog of D4/6l (CID 7211972), 6m (CID 25067404 (ML077)), which displayed good inhibition of KCC2 (73% at 1 μM).
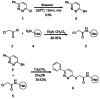
Scheme 1
Library synthesis of analogs of D4 (CID 24814385).
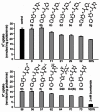
Figure 2
SAR of analogs of D4 (CID 7211972).
At this point, 6l (CID 7211972) and 6m (CID 25067404 (ML077)) were the leading probe candidates. As shown in Figure 3, 6m provided an IC50 of 537 nM for inhibiting KCC2 – >3-orders of magnitude improvement over bumetanide (KCC2 IC50 = 655 μM). Moreover, 6m was found to be highly selective for KCC2 versus NKCC1 (IC50 >>50 μM). The original hit, 6l (CID 24814385) afforded similar results.

Figure 3
A) KCC2 CRC for 6m and bumetanide; B) Selectivty. CRCs for 6m on KCC2 and NKCC1.
At this point, the Lead Profiling Screen (68 GPCRs, ion channels and transporters) from MDS Pharma was performed on the two probe candidates (CID 7211972 and CID 25067404 (ML077)) to attempt to distinguish which would be promoted to probe status. CID 25067404 (ML077) (SID-56405461) possessed superior ancillary profile to CID 25010774 (Figure 4), with NO activities >50% at 10 μM, and was thus declared an MLPCN probe. CID 7211972 possessed 5 significant activities (>50% inhibition at 10 μM) and numerous activities in the 40–50% range of inhibition at 10 μM at other K+ and Ca+ ion channels and transporters. The old medicinal chemistry ‘trick’ of dialing out ancillary ion channel activity with a tertiary amide analog proved successful. CID 25067404 (ML077) has the following IUPAC nomenclature: N- methyl-N-(4 methylthiazol-2-yl)-2-(6-phenylpyriadizin-3-ylthio)acetamide. Scheme 2 highlights the optimized route to prepare CID 25067404 (ML077) as the mono-HCl salt in 82.5% overall yield. All of the reagents are commercially available from Aldrich Chemical company. A Mixture of 3-chloro-6-phenylpyridazine 1 (1.5g, 7.87mmol) and thiourea (4g) was irradiated at 220oC for 15 min by microwave. The cooled solution was diluted with water to remove excess amount of thiourea. The product was filtered, washed with water, dried over in vacuo, and recrystallized from methanol to afford a brown solid 6-phenylpyridazine-3-thiol 2 (1.23g, 83%). 1H NMR (DMSO, 400 MHz) δ (ppm) 7.93–7.89 (m, 3H), 7.87 (d, J = 9.6 Hz, 2 H), 7.70 (d, J = 9.6 Hz, 2 H), 7.54–7.48 (m, 3 H); 13C NMR (DMSO, 100 MHz) δ (ppm) 179.23, 149.86, 141.78, 134.09, 130.55, 129.47, 126.38, 125.44; LCMS, single peak, 2.46 min, m/e, 189.04 (M+1). To a solution of 2-chloroacetyl chloride (3.6 mL, 43.8mmol) in dichloromethane (145mL) was added triethylamine (6.1mL, 43.8mmol) at 0 oC. The reaction mixture was stirred for 30min at 0 oC, quenched with saturated NH4Cl (50mL), and extracted with dichloromethane (3 x 40mL). The combined extracts were dried (MgSO4) and concentrated in vacuo to give 2-chloro-N-methyl-N-(4-methylthiazol-2-yl)acetamide 8 (7.90g, 95%). The mixture of 6-phenylpyridazine-3-thiol 2 (365mg, 1.92mmol) and 2-chloro-N-methyl-N-(4-methylthiazol-2-yl)acetamide 8 (300mg, 1.60mmol) in acetonitrile (5mL) was treated with cesium carbonate (782mg, 2.40mmol) at room temperature for 3h, then quenched with water (10mL), and extracted ethylacetate (3 x 10mL). The combined extracts were dried with MgSO4 and concentrated in vacuo affording crude product which was purified by flash column chromatography on silica gel (Hexane/Ethyl acetate = 7/3) to provide brown solid N-methyl-N-(4-methylthiazol-2-yl)-2- (6-phenylpyriadizin-3-ylthio)acetamide, CID 25064704. 1H NMR (DMSO, 400 MHz) δ (ppm) 8.08 (dd, J = 9.2, 7.6 Hz, 3 H), 7.83 (d, J = 9.2 Hz, 1 H), 7.53–7.50 (m, 3 H), 6.82 (s, 1H), 4.75 (s, 2 H), 3.81 (s, 3 H), 2.29 (s, 3 H); 13C NMR (CDCl3, 100 MHz) δ (ppm) 167.86, 160.18, 156.08, 146.50, 136.00, 130.29, 129.39, 126.89, 126.73, 124.44, 110.15, 35.27, 34.43, 17.55; LCMS, single peak, 3.13 min, m/e, 357.78 (M+1).
Figure 4
MDS Pharma Lead Profiling Screen of 68 GPCRs, ion channels and transporters against CID 25067404 (ML077) (SID-56405641) at a concentration of 10 μM.
Scheme 2
Synthesis of KCC2 antagonist probe CID 25067404 (6m).
We then calculated a number of in silico parameters for N-methyl-N-(4-methylthiazol-2-yl)- 2-(6-phenylpyriadizin-3-ylthio)acetamide, CID 25067404 (ML077) using TRIPOS ADME/TOX software. The KCC2 probe had the following profile: MW, 356.5; hydrogen bond donors, 0; hydrogen bond acceptors, 5; clogP, 1.8; XlogP, 2.5; total polar surface area, 58.9. The KCC2 antagonist probe, CID 25067404 (ML077), had no Rule of 5 violations and possessed a favorable calculated logP value, in agreement with known CNS agents.
The KCC2 antagonist probe, CID 25067404 (ML077), as the mono-HCl salt, possessed the following measured solubility profile: >50 mM in pure DMSO, ~10 mg/mL in saline.
The combination of KCC2 potency, selectivity versus NKCC1, broad panel selectivity, favorable calculated physiochemical properties and observed solubility profile, provides a best in class KCC2 antagonist probe which can be used in vitro to study KCC2 function with confidence.
MLS#s: MLS002279954, MLS002279955
Bibliography
- 1.
- Delpire E. NIPS. 2000;15:309–312. [PubMed: 11390932]
- 2.
- Delpire E, Mount DB. Ann Rev Physiol. 2002;64:803–843. [PubMed: 11826289]
- 3.
- Gamba G. Physiol Rev. 2005;85:423–493. [PubMed: 15788703]
- 4.
- Simon DB, Karet FE, Hamdan JM, Di Pietro A, Sanjad SA, Lifton RP. Nature Gen. 1996;13:183–188. [PubMed: 8640224]
- 5.
- Simon DB, Nelson-Williams C, Johnson Bia M, Ellison D, Karet FE, Morey Molina A, Vaara I, Iwata F, Cushner HM, Koolen M, Gainza FJ, Gitelman HJ, Lifton RP. Nature Genetics. 1996;12:24–30. [PubMed: 8528245]
- 6.
- Meyer JW, Flagella M, Sutliff RL, Lorenz JN, Nieman ML, Weber CS, Paul RJ, Shull GE. Am J Physiol Heart Circ Physiol. 2002;283:H1846–1855. [PubMed: 12384462]
- 7.
- Rust MB, Faulhaber J, Budack MK, Pfeffer C, Maritzen T, Didie M, Beck FX, Boettger T, Schubert R, Ehmke H, Jentsch TJ, Hubner CA. Circ Res. 2006;98:549–556. [PubMed: 16424367]
- 8.
- Woo N-S, Lu J, England R, McClellan R, Dufour S, Mount DB, Deutch AY, Lovinger DM, Delpire E. Hippocampus. 2002;12:258–268. [PubMed: 12000122]
- 9.
- Dzhala VI, Talos DM, Sdrulla DA, Brumback AC, Mathews GC, Benke TA, Delpire E, Jensen FE, Staley KJ. Nat Med. 2005;11:1205–1213. [PubMed: 16227993]
- 10.
- Howard HC, Mount DB, Rochefort D, Byun N, Dupré N, Lu J, Fan X, Song L, Rivière J-B, Prévost C, Welch R, England R, Zhan FQ, Mercado A, Siesser WB, George AL, Horst J, Simonati A, McDonald MP, Bouchard J-P, Mathieu J, Delpire E, Rouleau GA. Nat Genet. 2002;32:384–392. [PubMed: 12368912]
- 11.
- Shen MR, Chou CY, Hsu KF, Hsu YM, Chiu WT, Tang MJ, Alper SL, Ellory JC. J Biol Chem. 2003;278:39941–39950. [PubMed: 12902337]
- 12.
- Zhu L, Polley N, Mathews GC, Delpire E. Epilepsy Res. 2008;79:201–212. [PMC free article: PMC2394664] [PubMed: 18394864]
- 13.
- Morgado C, Pinto-Ribeiro F, Tavares I. Neurosci Lett. 2008;438:102–106. [PubMed: 18457921]
- 14.
- Coull JA, Boudreau D, Bachand K, Prescott SA, Nault F, Sik A, De Koninck P, De Koninck Y. Nature. 2003;424:938–942. [PubMed: 12931188]
- 15.
- Nomura H, Sakai A, Nagano M, Umino M, Suzuki H. Neurosci Res. 2006;56:435–440. [PubMed: 17007947]
- 16.
- Jolivalt CG, Lee CA, Ramos KM, Calcutt NA. Pain. 2008 In Press. [PMC free article: PMC2593464] [PubMed: 18755547]
- 17.
- Zhang W, Liu L-Y, Xu T-L. Neuroscience. 2008 [CrossRef]
- 18.
- 19.
- Cramer SW, Baggott C, Cain J, Tilghman J, Allcock B, Miranpuri G, Rajpal S, Sun D, Resnick D. Mol. Pain. 2008;4:36. [PMC free article: PMC2561007] [PubMed: 18799000]
- 20.
- Rybak LP. Otolaryngol Clin North Am. 1993;26:829–844. [PubMed: 8233492]
- 21.
- Ikeda K, Oshima T, Hidaka H, Takasaka T. Hearing Res. 1997;107:1–8. [PubMed: 9165341]
- 22.
- Delpire E, Lu J, England R, Dull C, Thorne T. Nat Genet. 1999;22:192–195. [PubMed: 10369265]
- 23.
- Lauf PK. J Membrane Biol. 1984;77:57–62. [PubMed: 6699902]
- 24.
- Payne JA. Am. J. Physiol. (Cell Physiol.). 1997;273:C1516–C1525. [PubMed: 9374636]
- 25.
- Mercado A, Song L, Vazquez N, Mount DB, Gamba G. J Biol Chem. 2000;275:30326–30334. [PubMed: 10913127]
- 26.
- Delpire E, Lauf PK. J Membrane Biol. 1992;126:89–96. [PubMed: 1593613]
- 27.
- Brugnara C, Kopin AS, Bunn HF, Tosteson DC. J Clin Invest. 1985;75:1608–1617. [PMC free article: PMC425502] [PubMed: 3998150]
- 28.
- Jennings ML. Annu Rev Biophys Biophys Chem. 1989;18:397–430. [PubMed: 2660831]
- 29.
- Kidd JF, Thorn P. Ann Rev Physiol. 2000;62:493–513. [PubMed: 10845100]
- 30.
- Weaver CD, Harden D, Dworetzky SI, Robertson B, Knox RJ. J Biomol Screen. 2004;9:671–677. [PubMed: 15634793]
- 31.
- Payne JA, Stevenson TJ, Donaldson LF. J Biol Chem. 1996;271:16245–16252. [PubMed: 8663311]
- PMCPubMed Central citations
- PubChem BioAssay for Chemical ProbePubChem BioAssay records reporting screening data for the development of the chemical probe(s) described in this book chapter
- PubChem SubstanceRelated PubChem Substances
- PubMedLinks to PubMed
- Further optimization of the K-Cl cotransporter KCC2 antagonist ML077: development of a highly selective and more potent in vitro probe.[Bioorg Med Chem Lett. 2012]Further optimization of the K-Cl cotransporter KCC2 antagonist ML077: development of a highly selective and more potent in vitro probe.Delpire E, Baranczak A, Waterson AG, Kim K, Kett N, Morrison RD, Daniels JS, Weaver CD, Lindsley CW. Bioorg Med Chem Lett. 2012 Jul 15; 22(14):4532-5. Epub 2012 Jun 7.
- Characterization of an extracellular epitope antibody to the neuronal K-Cl cotransporter, KCC2.[Clin Exp Pharmacol Physiol. 2007]Characterization of an extracellular epitope antibody to the neuronal K-Cl cotransporter, KCC2.Gagnon KB, Fyffe RE, Adragna NC, Lauf PK. Clin Exp Pharmacol Physiol. 2007 Jul; 34(7):566-73.
- Role of NKCC1 and KCC2 in the development of chronic neuropathic pain following spinal cord injury.[Ann N Y Acad Sci. 2010]Role of NKCC1 and KCC2 in the development of chronic neuropathic pain following spinal cord injury.Hasbargen T, Ahmed MM, Miranpuri G, Li L, Kahle KT, Resnick D, Sun D. Ann N Y Acad Sci. 2010 Jun; 1198:168-72.
- Review Roles of the cation-chloride cotransporters in neurological disease.[Nat Clin Pract Neurol. 2008]Review Roles of the cation-chloride cotransporters in neurological disease.Kahle KT, Staley KJ, Nahed BV, Gamba G, Hebert SC, Lifton RP, Mount DB. Nat Clin Pract Neurol. 2008 Sep; 4(9):490-503.
- Review Two developmental switches in GABAergic signalling: the K+-Cl- cotransporter KCC2 and carbonic anhydrase CAVII.[J Physiol. 2005]Review Two developmental switches in GABAergic signalling: the K+-Cl- cotransporter KCC2 and carbonic anhydrase CAVII.Rivera C, Voipio J, Kaila K. J Physiol. 2005 Jan 1; 562(Pt 1):27-36. Epub 2004 Nov 4.
- Discovery of a Highly Selective KCC2 Antagonist - Probe Reports from the NIH Mol...Discovery of a Highly Selective KCC2 Antagonist - Probe Reports from the NIH Molecular Libraries Program
Your browsing activity is empty.
Activity recording is turned off.
See more...