

NCBI Bookshelf. A service of the National Library of Medicine, National Institutes of Health.
Probe Reports from the NIH Molecular Libraries Program [Internet]. Bethesda (MD): National Center for Biotechnology Information (US); 2010-.

Probe compound, ML199, and related inhibitors of Apurinic/apyrimidinic (AP) endonuclease (APE1) are reported herein. APE1 is a key component of the base excision repair (BER) pathway that is responsible for repair of DNA damage caused by many anti-cancer agents such as bleomycin and temozolomide. As a result, inhibition of APE1 has been postulated as a viable strategy for sensitizing tumor cells to chemotherapy. ML199 and its related analogs belong to a drug-like series that was identified and optimized through a focused medicinal chemistry effort to afford compounds which display competitive inhibition of APE1 activity in the low micromolar potency range. On target effect of the ML199 was demonstrated through a concentration depended inhibition of AP site incision activity in whole cell HeLa extracts. Moreover, ML199 potentiated the cytotoxicity of the DNA alkylating agent methylmethane sulfonate (MMS) at non-cytotoxic doses of the probe compound. The probe and its general class of compounds have shown to have good kinetic solubility, Caco-2 permeability, metabolic stability and other favorable physicochemical properties, thus making ML199 an ideal starting point for further pre-clinical development of anti-cancer agents.
Assigned Assay Grant #: MH086444
Screening Center Name & PI: NIH Chemical Genomics Center, Christopher P. Austin
Chemistry Center Name & PI: NIH Chemical Genomics Center, Christopher P. Austin
Assay Submitter & Institution: David M. Wilson III, NIH, National Institute on Aging
PubChem Summary Bioassay Identifier (AID): 2324
Probe Structure & Characteristics

ML199
| CID/ML# | Target Name | IC50/EC50 (nM) [SID, AID] | Anti-target Name(s) | IC50/EC50 (μM) [SID, AID] | Fold Selective | Secondary Assay(s) Name: IC50/EC50 (nM) [SID, AID] |
|---|---|---|---|---|---|---|
| CID 46925884/ML199 | APE1 | 6000 nM IC50 [SID 99430950, AID 2572] | Thiazole orange counterscreen | > 57 μM IC50 [SID 99430950, AID 2741] | > 10 fold | RIA gel assay: 1000 nM IC50 [SID 99430950, AID 488940] |
Recommendations for Scientific Use of the Probe
The novel optimized probe described in this report (ML199) can be used for target validation of APE1 in enzymatic and cell-based systems. It can also be used in combination with known DNA cancer chemotherapeutics, such as temozolomide (TMZ), to potentiate the activity of these agents. It can be utilized in studies involving the BER pathway and the potentiation of known cancer chemotherapeutics. Lastly, the general class of this probe and its analogs has good in vitro ADME properties, making the probe series useful in further optimization for potential in vivo exposure.
1. Introduction
The goal of this project is to develop chemical probes directed at the human BER enzyme, APE1. Such probes will enhance our understanding of the role of APE1 in normal and cancer cells and may provide opportunities for developing novel anticancer agents that potentiate genotoxic treatments. BER is the major pathway for dealing with spontaneous hydrolytic, oxidative and alkylative base and sugar damage to DNA1. Central to this process is incision at an apurinic/apyrimidinic (AP) site that is generated either spontaneously or via the enzymatic activity of a DNA repair glycosylase. This strand cleavage step is performed by the main, if not sole, mammalian AP endonuclease, APE12,3. APE1 has been found to be essential for not only animal viability, as deletion of both alleles of the APE1 gene in mice leads to embryonic lethality4, but also for cell viability in culture5,6. Moreover, past studies incorporating either antisense or RNAi strategies have revealed that APE1-deficient cells exhibit hypersensitivity to a number of “DNA-damaging” agents, including the laboratory chemicals methyl methanesulfonate (MMS), hydrogen peroxide, menadione and paraquat, and the anticancer agents ionizing radiation, thiotepa, 1,3-bis(2-chloroethyl)-1-nitrosourea (a.k.a. Carmustine), TMZ, gemcitabine, and the nucleoside analog ß-L-dioxolane-cytidine (a.k.a. Troxacitabine)7. Recent work from the Wilson group employing a dominant-negative APE1 protein (termed ED), which binds with high affinity to substrate DNA and blocks subsequent repair steps8, has shown that ED augments the cell killing of 5-fluorouracil (~fivefold) and 5-fluorodeoxyuridine (~thirtyfold), implicating BER in the cellular response to such antimetabolites as well. These data underscore the potential of APE1 as an inhibitor target in the effort to improve therapeutic efficacy of clinical DNA-interactive drugs through inactivation of DNA repair responses9.
Most drugs employed to eradicate neoplastic disease (e.g. alkylators, cross-linking agents, intercalating agents, topoisomerase inhibitors, DNA cleaving agents and certain antimetabolites) operate by inducing the formation of complex DNA lesions/intermediates that ultimately block replication of rapidly dividing cells, such as cancer cells, and activate cell death responses. A primary goal of current studies is to devise combinatorial methods that (a) protect normal cells from the toxic effects of anti-cancer agents and (b) enhance the sensitivity of tumor cells. As alluded to above, DNA repair systems represent a major protective mechanism against the cytotoxic effects of clinical DNA-interactive compounds. Thus, recent efforts have focused on the design of novel small molecule inhibitors of specific DNA repair proteins, for instance, the DNA strand break response protein poly(ADP)ribose polymerase PARP110.
Whereas extensive studies have been performed using various genetic and molecular techniques to delineate the cellular effects of a BER deficiency, experiments employing inhibitor molecules are comparatively lacking and would complement existing knowledge and potentially provide novel biological insights. Moreover, recent evidence has implicated BER capacity as an important factor in determining individual responsiveness to clinical DNA-interactive agents, most notably alkylators (e.g. TMZ) and antimetabolites (e.g. 5-fluorouracil and certain nucleoside analogs) used in the treatment of cancer, and in some instances, viral infections11. Alkylators induce cell killing through the formation of alkylated bases, many of which are either lost spontaneously to form abasic sites or are substrates for DNA glycosylases12; TMZ is a promising drug recently added to the arsenal of alkylating agents for the adjuvant chemotherapy of brain cancers due to its ability to readily cross the blood-brain barrier13. The antimetabolite 5-fluorouracil, which has been used clinically for ~40 years and is commonly employed in the eradication of colorectal and pancreatic cancers, induces cell death by promoting the introduction of uracil and fluorouracil bases into DNA, which are ultimately processed by BER glycosylases14,15. All told, BER inhibitors or activators would provide novel resources that may improve efficacy of current treatment paradigms by promoting selective sensitization or protection of diseased and normal cells, respectively. In vitro inhibitors of APE1 identified within are prospective reagents for the design of high affinity compounds with potential therapeutic value in combinational treatments.
Prior Art
Compound 116 (see Table 1) was the first reported direct APE1 AP endonuclease inhibitor and is currently sold by Sigma-Aldrich chemical company; however, several groups have failed to reproduce the APE1 inhibitory activity of this compound. In agreement with these findings, our group was also unable to reproduce the activity in both the HTS and radiotracer incision assays. Arylstilbonic acid 2 displays potent activity against APE1 with a submicromolar IC50 (low micromolar in our assay); however, this class of compounds has limited efficacy in cellular assays due to poor cellular uptake17. Zawahir et al. described the utilization of a pharmacophore model to identify compounds such as 3, which display low μM inhibition against APE1 incision activity. However, given the presence of three carboxylic acid moieties in many of their described inhibitors, it is unlikely that these compounds will have acceptable cell permeability18. Additionally, this report contained limited biochemical data using a purified enzyme assay; thus, the compounds’ utility as APE1 probes is unknown.
Most recently, Kelley and co-workers19 described the HTS of 60,000 small molecules and found several low micromolar hits against APE1. The most promising was compound 4, which had a reported IC50 of 2.1 μM in whole cell extract AP endonuclease assays and inhibited the repair of AP sites in SF767 glioblastoma cells. Moreover, AR03 was reported to potentiate the cytotoxicity of the alkylators methyl methansulfonate (MMS) and TMZ in SF767 cells. This compound is actually a part of the MLSMR library (MLS000552981) and had weak activity in our assay, ~31 μM. While the reason for this discrepancy is not fully understood, it may likely be due to the differences in AP endonuclease conditions used in the respective studies. Nevertheless, these studies provide us a direct comparison of our probe compound with previously reported APE1 inhibitors.
During the course of our assay development and LOPAC screening, we identified aurintricarboxylic acid (ATA, a stable radical polymer), 6-hydroxy-DL DOPA, Tyrphostin AG 538, myricetin, thiolactomycin, and mitoxantrone as inhibitors of APE1 AP site incision activity20 (seeFigure 1). These compounds have been noted to affect multiple targets, including numerous DNA-processing enzymes. In addition to their known promiscuous nature, none of the compounds represented a good starting point for extensive optimization.

Figure 1
Hit compounds identified from the LOPAC screen.
2. Materials and Methods
General Methods for Chemistry. Unless otherwise stated, all reactions were carried out under an atmosphere of dry argon or nitrogen in dried glassware. Indicated reaction temperatures refer to those of the reaction bath, while room temperature (rt) is noted as 25 °C. All solvents were of anhydrous quality, purchased from Aldrich Chemical Co. and used as received. Commercially available starting materials and reagents were purchased from Aldrich and were used as received. Analytical thin layer chromatography (TLC) was performed with Sigma Aldrich TLC plates (5 × 20 cm, 60 Å, 250 μm). Visualization was accomplished by irradiation under a 254 nm UV lamp. Chromatography on silica gel was performed using forced flow (liquid) of the indicated solvent system on Biotage KP-Sil pre-packed cartridges and the Biotage SP-1 automated chromatography system. 1H- and 13C NMR spectra were recorded on a Varian Inova 400 MHz spectrometer. Chemical shifts are reported in ppm with the solvent resonance as the internal standard (CDCl3 7.26 ppm, 77.00 ppm, DMSO-d6 2.49 ppm, 39.51 ppm for 1H, 13C respectively). Data are reported as follows: chemical shift, multiplicity (s = singlet, d = doublet, t = triplet, q = quartet, br = broad, m = multiplet), coupling constants, and number of protons. Low resolution mass spectra (electrospray ionization) were acquired on an Agilent Technologies 6130 quadrupole spectrometer coupled to the HPLC system. High resolution mass spectral data were collected in-house using an Agilent 6210 time-of-flight mass spectrometer, also coupled to an Agilent Technologies 1200 series HPLC system. If needed, products were purified via a Waters semi-preparative HPLC equipped with a Phenomenex Luna® C18 reverse phase (5 micron, 30 × 75 mm) column having a flow rate of 45 mL/min. The mobile phase was a mixture of acetonitrile (0.025% TFA) and H2O (0.05% TFA), and the temperature was maintained at 50 °C.
Samples were analyzed for purity on an Agilent 1200 series LC/MS equipped with a Luna® C18 reverse phase (3 micron, 3 ×75 mm) column having a flow rate of 0.8–1.0 mL/min over a 7-minute gradient and an 8.5 minute run time. Purity of final compounds was determined to be >95%, using a 3 μL injection with quantitation by AUC at 220 and 254 nm (Agilent Diode Array Detector).
2.1. Assays
APE1 qHTS Assay: Inhibition of APE1 activity was screened (AID 2517) by utilizing double-stranded short substrate containing a tetrahydrofuran (THF) abasic site labeled with rhodamine-type fluorophore (TAMRA) at the 5′-end and with non-fluorescent Black Hole Quencher-2 (BHQ-2) at the opposing 3′-end. An increase in the fluorescence intensity due to incision of the abasic site by APE1 was used to measure the enzyme activity. Three μL of enzyme were dispensed to 1536-well Greiner black solid bottom plates. Compounds (23 nL) were transferred via Kalypsys pintool. The plates were incubated for 15 min at room temperature, and then 1 μL of substrate solution was added to start the reaction. The plates were immediately transferred into a ViewLux High-throughput CCD imager (Perkin-Elmer) in order to measure the reaction progress in kinetic mode (three reads every 60 seconds) using a 525 nm excitation and 598 nm emission fluorescence protocol. The fluorescence intensity difference between the third and the first time points was used to compute reaction progress. Reagents and Controls: Substrate: 50 nM final concentration of TAMRA/BHQ-2 substrate dispensed throughout the plate. Enzyme: 0.75 nM APE1 final concentration in columns 1, 2, 5–48. Column 1 is neutral (100% activity). Control: Pintool transfer of control inhibitor NSC-13755 to column 2 of all assay plates. Two-fold, 16-pt dilution in duplicate to produce final concentrations in the 5.75 μM – 0.175 nM range. Buffer columns in columns 3 and 4 were used as negative control (no enzyme).
Thiazole Orange Assay for Promiscuous DNA Binding: In order to distinguish true inhibitors of DNA-processing enzymes from promiscuous DNA-binding compounds among screening assay hits, we developed a homogeneous and miniaturized assay (AID 2741) based on fluorescent dye displacement test as originally described by Tse and Boger21. The assay is based on the strong enhancement of fluorescence when Thiazole Orange (ThO) binds to double-stranded DNA; conversely, in the presence of a DNA-binding compound, Thiazole Orange is displaced from the DNA and its fluorescence is reduced. Three μL of reaction buffer (50 mM Tris-HCl pH7.5, 50 mM NaCl, 2 mM MgCl2, 1 mM DTT and 0.01% Tween-20) containing 250 nM ThO and 50 nM dsDNA (upper strand 5′ TC ACC FTC GTA CGA CTC, lower strand 3′ AG TGG GAG CAT GCT GAG, F denotes tetrahydrofuran) were dispensed into a 1536-well Greiner black assay plate via solenoid-valve based nanoliter dispensers. Compounds (23 nL each in columns 5–48) and control (23 nL each in column 2 as dose-response) were transferred via a Kalypsys pintool equipped with a 1536-pin array. The plates were incubated for 15 min at room temperature and were then transferred into a ViewLux high-throughput CCD imager, where the endpoint fluorescence was measured using a 480 nm excitation and 540 nm emission protocol.
Radiotracer Incision Assay (RIA). Recombinant wild type APE1 protein was purified as previously described22. Fifty pg of APE1 (~140 pM) was incubated without (positive control containing 1% DMSO) or with 100 μM of the indicated inhibitor at room temperature in RIA buffer (50 mM Tris pH 7.5, 25 mM NaCl, 1 mM MgCl2, 1 mM DTT, 0.01% Tween -20) for 15 min. One-half pmol of 32P 5′-radiolabeled AP-DNA substrate (18 mer) was added to a 10 μL final volume23, and the reactions were incubated at 37 °C for 5 min and stopped by adding stop buffer (0.05% Bromophenol blue/ Xylene cyanol dissolved in 95% formamide, 20 mM EDTA) and heating at 95 °C for 10 min. Intact substrate was separated from incised product on a 15% polyacrylamide denaturing gel in tris boric acid EDTA buffer. Following electrophoresis, the gel was subjected to standard phosphoimager analysis using the ImageQuant 5.2 software, and the percent incision activity (amount of substrate converted to product) was calculated. For IC50 determinations (i.e. the concentration of inhibitor at which 50% inactivation was observed), 50 pg of APE1 (~140 pM) was incubated without or with increasing concentrations (1 nM to 100 μM) of the indicated inhibitor as above, and the percent incision activity was determined. IC50s were extrapolated from duplicate experimental sets after plotting the results using GraphPad Prism 4.0. PubChem AID 488940.
Electrophoretic Mobility Shift Assay (EMSA). Three hundred ng of APE1 (~0.8 μM) was incubated without inhibitor (positive control, 1% DMSO) or with increasing concentrations of inhibitor (1, 3, 10, 30 pr 100 μM) in binding buffer (50 mM Tris pH 7.5, 25 mM NaCl, 1 mM EDTA, 1 mM DTT, 10% glycerol, 0.01% Tween 20) for 10 min on ice, and then radiolabeled 32P AP-DNA substrate (100 fmol) was added to a 10 μL final volume. Following incubation on ice for 5 min, samples were subjected to non-denaturing polyacrylamide gel electrophoresis (20 mM Tris pH 7.5, 10 mM sodium acetate, 0.5 mM EDTA, 8% polyacrylamide, 2.5% glycerol) for 2 hr at 120 V in electrophoresis buffer (20 mM Tris pH 7.5, 10 mM sodium acetate, 0.5 mM EDTA) to separate the APE1-DNA complex from unbound radiolabeled DNA24. After electrophoresis, the gel was subjected to standard phosphoimager analysis as above, and the percentage of substrate DNA in complex with APE1 was determined.
HeLa Whole Cell Extract Incision Assay. HeLa cells maintained in DMEM with 10% fetal bovine serum and 1% Penicillin-Streptomycin were harvested, washed with 1X PBS, and re-suspended in hypotonic ice cold lysis buffer (50 mM Tris pH 7.4, 1 mM EDTA, 1 mM DTT, 10% glycerol, 0.5 mM PMSF). The suspension was frozen at −80 °C for at least 30 min and then slowly thawed at 4 ºC for ~1 hr. KCl was then added to the cell suspension to a final concentration of 222 mM, followed by incubation on ice for 30 min and clarification by centrifugation at 12,000 xg for 15 min at 4 ºC. The supernatant (whole cell extract) was retained, the protein concentration determined using the Bio-Rad Bradford reagent, and aliquots stored until needed at −80 ºC. Three hundred ng of HeLa whole cell extract was incubated with 0, 50 or 100 μM of the indicated inhibitor at room temperature for 15 min prior to the addition of 0.5 pmol of 32P radiolabeled AP-DNA substrate (final volume of 10 μL). The reaction mix was then transferred to 37 ºC for 5 min to allow for incision. Following addition of stop buffer and heat denaturation, the reaction products were analyzed as above.
MMS Potentiation Cell-based Assay. HeLa cells were plated by multichannel pipette or Multidrop Combi dispenser (Thermo) at 6K/25 μL/well in DMEM culture medium, plus 10% FBS, into white solid bottom 384-well cell culture plates. The plates were incubated at 37 ºC overnight for cell attachment. The following day, the cell medium in each well was replaced with fresh medium containing MMS (0.4 mM final concentration) and/or serial dilutions of compounds of interest, except for the vehicle controls. The plates were incubated for 24 hr at 37 ºC. Cell viability was evaluated by adding 15 μL of CellTiter Glo reagent (Promega, Madison, WI) and incubating the plate at room temperature for 30 min, and subsequently measuring the luminescence in ViewLux reader. Percent viability was calculated for each concentration of tested compounds in duplicates, relating the luminescence to the negative DMSO control. MMS potentiation trends were defined as follows: (−), if cell viability was the same as that of the DMSO control; (+), if the cell viability decrease was between 20–40%; and (++), if the cell viability decrease was more than 40% in presence of test compounds.
2.2. Probe Chemical Characterization

*Purity >95% as judged by LC/MS and 1H NMR
N-(3-(benzo[d]thiazol-2-yl)-5,6-dihydro-4H-thieno[2,3-c]pyrrol-2-yl)acetamide: LC-MS: rt (min) = 3.98; 1H NMR (400 MHz, DMSO-d6) δ 2.36 (s, 3 H), 4.54 (s, 2 H), 4.68 (s, 2 H), 7.49 (t, J = 7.6 Hz, 1 H), 7.61 (t, J = 7.7 Hz, 1 H), 8.17 (t, J = 7.5 Hz, 2 H), 9.94 (brs, 1 H), and 12.03 (brs, 1 H); HRMS (ESI) m/z (M+Na)+ calcd. for C15H13N3OS2Na, 338.0403; found 338.0403.
LC/MS conditions
- LC/MS (Agilent system) Retention time t1 (short) = 2.88 min and t2 (long) = 3.88.
- Column: 3 × 75 mm Luna C18, 3 micron
- Run time: 4.5 min (short); 8.5 min (long)
- Gradient: 4 % to 100 %
- Mobile phase: Acetonitrile (0.025 % TFA), water (0.05 % TFA)
- Flow rate: 0.8 to 1.0 mL
- Temperature: 50°C
- UV wavelength: 220 nm, 254 nm
MLSMR Numbers for Probe and Analogs
| MLS ID | NCGC ID | SID | CID | ML | Type |
|---|---|---|---|---|---|
| MLS003178551 | NCGC00185090 | SID 99430950 | CID 46925884 | ML199 | Probe |
| MLS003178552 | NCGC00184830 | SID 99430935 | CID 4055306 | Analog | |
| MLS003178553 | NCGC00184832 | SID 99430937 | CID 46925888 | Analog | |
| MLS003178554 | NCGC00184834 | SID 99430938 | CID 46925885 | Analog | |
| MLS003178555 | NCGC00185094 | SID 99430953 | CID 46925861 | Analog | |
| MLS003178556 | NCGC00186101 | SID 99430962 | CID 46925887 | Analog |
Probe in vitro ADME properties
- Aqueous (kinetic) solubility in PBS buffer (pH 7.4 @ 25 °C): 51.6 μM
- Caco-2 permeability (Papp × 106)/cm-s−1: 6.8
- Efflux ratio (B→A)/(A→B): 0.81
- hERG inhibition-Qpatch-whole-cell patch clamp (IC50): 8.04 μM (note original “hit” was 0.66 μM)
- mouse plasma stability (T ½) = >120 min

Figure 2Buffer Stability (48 hrs @ 25 °C) of ML199
2.3. Probe Preparation
The synthesis commenced using the Gewald’s 2-aminothiophene reaction25 of commercially available t-butyl-3-oxopyrrolidine-1-carboxylate in the presence of sulfur and morpholine to afford the fused product26 (see Scheme 1). The regiochemistry of the formed product was determined by NMR spectroscopy. Acetylation of the 2-amino group was achieved with acetyl choride in the presence of triethyl amine, and subsequent Boc-deprotection with TFA gave the probe molecule in good yield.

Scheme 1
Synthetic route to ML199.
Preparation oft-butyl 2-amino-3-(benzo[d]thiazol-2-yl)-4H-thieno[3,2-c]pyrrole-5(6H)-carboxylate (Step 1): A mixture of t-butyl 3-oxopyrrolidine-1-carboxylate (1.0 g, 5.4 mmol, 1 eq.), 2-(benzo[d]thiazol-2-yl)acetonitrile (0.94 g, 5.4 mmol, 1 eq.), sulfur (0.17 g, 5.4 mmol, 1 eq.) and morpholine (0.47 mL, 5.4 mmol, 1 eq.) in ethanol (25 mL) was refluxed for 1 hr. Excess solvent was removed under diminished pressure and the crude product was recrystallized from ethanol. Yield: 1.6 g (79%).
Preparation oft-butyl 2-acetamido-3-(benzo[d]thiazol-2-yl)-4H-thieno[3,2-c]pyrrole-5(6H)-carboxylate (Step 2): To a mixture of t-butyl 2-amino-3-(benzo[d]thiazol-2-yl)-4H-thieno[3,2-c]pyrrole-5(6H)-carboxylate (1.0 g, 2.7 mmol, 1 eq.) and triethylamine (1.1 mL, 8.0 mmol, 3 eq.) in dichloromethane (25 mL) was added acetyl chloride (0.29 mL, 4.0 mmol, 1.5 eq.) dropwise at 0 °C. The reaction mixture was stirred at room temperature for 2 hrs, then diluted with dichloromethane, and the organic layer was successively with water, saturated bicarbonate solution and brine. The organic layer was dried on sodium sulfate and evaporated to afford the crude solid which was further purified on a Biotage® silica gel column. Gradient elution with 2% methanol in dichloromethane gave the product. Yield: 0.99 g (89%).
Preparation ofN-(3-(benzo[d]thiazol-2-yl)-5,6-dihydro-4H-thieno[3,2-c]pyrrol-2-yl)acetamide (step 3):t-Butyl 2-acetamido-3-(benzo[d]thiazol-2-yl)-4H-thieno[3,2-c]pyrrole-5(6H)-carboxylate (0.5 g, 1.59 mmol) in dichloromethane (10 mL) was added with TFA (5 mL) and was stirred at room temperature for 1 h. The volatiles were removed under reduced pressure and the crude product was purified in a preparative HPLC (see general methods for details) to afford the pure product.
General Procedure for reductive amination (for analogs containing substitution on piperidine nitrogen): Sodium cyanoborohydride (3 mmol, 3 eq.) and few drops of acetic acid were added to a mixture of appropriate amine (1 mmol, 1 eq.) and acetone/appropriate carbonyl compound (10 mmol, 10 eq.) in a mixture of MeOH/THF (0.2 molar reaction concentration). The reaction mixture was stirred at room temperature for 6–10 h. Volatiles were removed and the crude solid was purified on a preparative HPLC.
3. Results
3.1. Summary of Screening Results
A robust modified donor/quencher-based assay was further miniaturized into a 1536-well format and used to identify small molecule inhibitors of APE1. Briefly, a deoxyoligonucleotide containing a tetrahydrofuran (THF) abasic-site analog labeled on the 5′-end with 6-TAMRA was annealed to its complementary strand, where the 3′-end was labeled with a Black Hole Quencher-2 (BHQ2), to create an artificial DNA substrate for the APE1 enzyme. Upon cleavage of the abasic site by APE1, a short deoxyoligonucleotide product labeled with TAMRA was spontaneously released from the remaining DNA, causing the fluorophore emission to increase by up to 10-fold under the assay conditions. Prior to the full-collection screen, the assay was tested and found to perform reproducibly by screening the LOPAC1280 (library of pharmacologically active compounds) in triplicate using a fully-integrated robotic system. The assay was then applied to screen a 239,513-compound library arrayed as seven-point titrations ranging from 57 μM to 2.9 nM. In total, 1,339 assay plates, containing 2,056,704 wells, were screened in one continuous robotic run lasting approximately 84 hrs. Overall, the assay performed well during the entire course of the screen: intra-plate control titration (NSC 13755) was stable, with an average IC50 of 0.035 μM and a minimum significant ratio of 1.9; the Z’ factor remained consistent without fluctuations, at an average of 0.79.
In contrast to traditional HTS, qHTS provides a concentration response curve (CRC) for each compound and allows for calculation of an AC50 value (defined as the half-maximal activity concentration) for each compound in the primary screen. In this screen, the inhibition associated with each well was computed from the alteration in fluorescence intensity over the time-course measurement period, normalized against control wells. Analysis of the qHTS results revealed that the top filtered samples (based on curve quality and potency) led to 121 clusters and 154 singletons, consisting of approximately 1,100 compounds with full concentration-response curves and IC50 values of less than 30 μM. Results can be seen in Figure 3. To define the structure activity relationship (SAR) between the various compounds that elicited inhibition of APE1 activity, we clustered the structures showing high and low quality CRC by structural similarity. This enabled us to find a series of inhibitors with a common core and to query the entire qHTS dataset to identify those related structures associated with a weaker CRC or inactivity. This approach allows determination of a complete SAR from the qHTS to be developed for novel lead compounds. After exclusion of strong auto-fluorescent compounds, compounds active in the thiazole orange dye displacement DNA binding assay, antimony-containing compounds, and various mercury and other heavy-metal-containing molecules, 471 compounds remained. These were tested in a radiotracer assay for orthogonal confirmation, resulting in the identification of the present chemotype (seeFigure 4). The initial active for probe chemotype is CID 3581333 (MLS000419194, resynthesized as NCGC00183664-01).

Figure 3
Activity from the primary qHTS screen (A) and distribution of the assay response against the chemical library (B).
3.2. Dose Response Curves for Probe
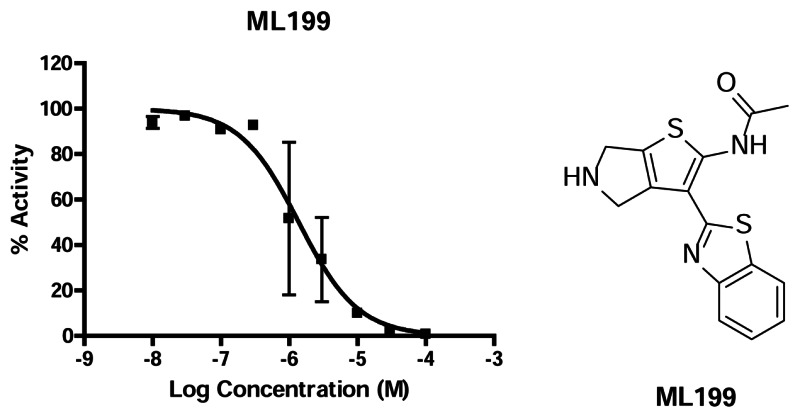
Figure 4Dose response from ML199 in Radiotracer Incision Assay and structure of the probe
3.3. Scaffold/Moiety Chemical Liabilities
While many of the series found in the qHTS contained reactive functional groups, the series chosen for probe development did not contain any serious liabilities.
3.4. SAR Tables
Table 1SAR Table - APE1 inhibition: representative analogs
 | |||||||
|---|---|---|---|---|---|---|---|
| Entry | CID | SID | NCGC IDs | R1 | R2 | R3 | HTS potency (μM) [RIA IC50 (μM)], n= replicates |
| 1 | 3581333 | 99430932 | NCGC00183664-01 | Me | benzothiazole | CH(CH3)2 | 10 [19], n = 2 |
| 2 | 46925879 | 99430934 | NCGC00184829-01 | Me | benzothiazole | H | 6 [5], n = 2 |
| 3 | 46925863 | 99430933 | NCGC00184828-01 | Me | benzothiazole | Boc | 31 [ND], n = 2 |
| 4 | 4055306 | 99430935 | NCGC00184830-01 | Me | benzothiazole | Me | 6 [5], n = 2 |
| 5 | 4532325 | 99430936 | NCGC00184831-01 | Me | benzothiazole | Bn | 18 [ND], n = 2 |
| 6 | 4348310 | 99430945 | NCGC00185083-01 | Me | benzothiazole | Ac | 10 [5], n = 2 |
| 7 | 46925878 | 99430951 | NCGC00185091-01 | Me | H | H | >56 [ND], n = 2 |
| 8 | 46925860 | 99430960 | NCGC00186096-01 | Me | 2-furan | H | 18 [ND], n = 2 |
| 9 | 46925883 | 99430961 | NCGC00186097-01 | Me | 2-thiophene | H | 36 [ND], n = 2 |
| 10 | 46925887 | 99430962 | NCGC00186101-01 | Me | 2-benzofuran | H | 18 [ND], n = 2 |
| 11 | 46925876 | 99430963 | NCGC00187565-01 | Me | 2-indole | H | >56 [ND], n = 2 |
| 12 | 46925880 | 99430964 | NCGC00187566-01 | Me | 2-thiazole | H | 23 [ND], n = 2 |
| 13 | 46925872 | 99430959 | NCGC00186075-01 | Me | Ph | H | >56 [ND], n = 2 |
| 14 | 46925888 | 99430937 | NCGC00184832-01 | Me | benzoxazole | CH(CH3)2 | 23 [13], n = 2 |
| 15 | 46925885 | 99430938 | NCGC00184834-01 | Me | 2-(4-phenylthiazole) | CH(CH3)2 | 6 [3], n = 2 |
| 16 | 4138521 | 99430940 | NCGC00184838-01 | C(CH3)3 | benzothiazole | CH(CH3)2 | 25 [ND], n = 2 |
| 17 | 4053204 | 99430941 | NCGC00184839-01 | cyclopropane | benzothiazole | CH(CH3)2 | 18 [ND], n = 2 |
| 18 | 43950654 | 99430942 | NCGC00184840-01 | cyclopropane | benzothiazole | CH(CH3)2 | 11 [ND], n = 2 |
| 19 | 4107484 | 99430939 | NCGC00184837-01 | Ph | benzothiazole | CH(CH3)2 | 16 [ND], n = 2 |
| 20 | 46925867 | 99430944 | NCGC00185082-01 | CF3 | benzothiazole | H | 31 [ND], n = 2 |
| 21 | 46925862 | 99430967 | NCGC00189087-01 | OMe | benzothiazole | H | 6 [ND], n = 2 |
| 22 | 46925861 | 99430953 | NCGC00185094-01 | CHF2 | benzothiazole | H | 3 [4], n = 2 |
| 23 | 46925869 | 99430946 | NCGC00185085-01 | (CH2)2C≡CH | benzothiazole | H | 14 [ND], n = 2 |
| 24 | 46925865 | 99430947 | NCGC00185086-01 | (CH2)2C≡CH | benzothiazole | CH(CH3)2 | 11 [ND], n = 2 |
| 25 | 46925871 | 99430966 | NCGC00189084-01 |
 | benzothiazole | H | >56 [ND], n = 2 |
| 26 | 46925873 | 99430965 | NCGC00189083-01 |
 | benzothiazole | H | 23 [ND], n = 2 |
| 27 | 46925877 | 99430969 | NCGC00189234-01 |
 | benzothiazole | H | 16 [ND], n = 2 |
| 28 | 46925868 | 99430968 | NCGC00189233-01 |
 | benzothiazole | H | 16 [ND], n = 2 |
| 29 | 46925866 | 46925866 | NCGC00184843-01 | NH2 | benzothiazole | CH(CH3)2 | 41 [ND], n = 2 |
Note: all compounds in table were synthesized at NCGC. ND = not determined.
Table 2SAR Table - APE1 inhibition: representative analogs
 | |||||
|---|---|---|---|---|---|
| Entry | CID | SID | NCGC IDs | R | HTS potency (μM) [RIA IC50 (μM)], n= replicates |
| 30 | 46925881 | 99430948 | NCGC00185087-01 | O | 18 [ND], n = 2 |
| 31 | 46925864 | 99430949 | NCGC00185089-01 | S | 16 [ND], n = 2 |
| 32 | 46925882 | 99430955 | NCGC00185096-01 | S(O)2 | 11* [77], n = 2 |
| 33 | 46925874 | 99430954 | NCGC00185095-01 | NH | 45 [ND], n = 2 |
| 34 | 46925884 | 99430950 | NCGC00185090-01 | NH | 6 [1], n = 2 |
| 35 | 46925875 | 99430952 | NCGC00185093-01 | N(CH(CH3)2 | 3 [4], n = 2 |
| 36 | 46925870 | 99430958 | NCGC00185100-01 | N(CH(CH3)2 | 18 [13], n = 2 |
| 37 | 46925889 | 99430956 | NCGC00185097-01 | N(CH(CH3)2 | 16 [14], n = 2 |
| 38 | 46925886 | 99430957 | NCGC00185099-01 | NH | 18 [7], n = 2 |
Note: all compounds in table were synthesized at NCGC. ND = not determined.
- *
low maximum response in HTS.
3.5. Cellular Activity
Cytotoxicity Studies (MTT Assay) of ML199
- HeLa cells: % viability- (98% @ 5 μM), (79% @ 20 μM), (~5% @ 50 μM)
- T98G cells: % viability- (99% @ 5 μM), (95% @ 20 μM), (~80% @ 50 μM)
- U-87 MG cells: % viability- (35% @ 5 μM), (20% @ 20 μM), (~20% @ 50 μM)
- U-138 MG cells: (92% @ 5 μM), (80% @ 20 μM), (~50% @ 50 μM)
MMS Potentiation

Figure 5Potentiation of probe ML199 in the presence or absence of MMS
3.6. Profiling Assays
ADME profiling
As shown in the Table 3, both compound 1 (CID 3581333) and the probe molecule 34 (ML199, seeTable 2) have many favorable attributes, yet a few liabilities exist. Compound 34 was chosen as the probe molecule because of its greatly improved potency in the secondary radiotracer assay (1 μM for 34 vs. 19 μM for 1). The probe molecule also exhibits improved kinetic solubility, Caco-2 permeability and 10-fold less inhibition of the hERG channel or the HTS “hit” compound. Though the probe molecule is susceptible to mouse liver microsomes, compound 1 shows favorable stability. This seems to indicate that the general core scaffold is metabolically stable, and through additional structural modifications, this potential liability of the probe molecule could be addressed while maintaining potency.
Table 3
In vitro ADME to date.
No additional profiling studies have been conducted on the probe compound. This novel probe does not have any additional data in literature or in PubChem.
4. Discussion
Our initial SAR investigations involved modification of the piperidine nitrogen moiety (see entries 1–6 in Table 1). Changes to this position were well tolerated except for the introduction of the Boc-group (entry 3), which resulted in a 3-fold loss of activity. Removal of the isopropyl group (R3 = H, entry 2) led to an increase in potency [IC50 = 6 μM (HTS assay) and 5 μM (RIA)]. Consequently, many of the subsequent analogs were synthesized without the isopropyl group, which saved one synthetic step.
The next area of SAR exploration involved modification of the benzothiazole moiety at the 3-position of the thiophene. As shown in the SAR Table above, many of the changes were not well tolerated; however, select modifications maintained activity of the parent compound. Removal of the benzothiazole (R2 = H, entry 7) resulted in essentially complete loss in activity. Other heterocycles were synthesized (entries 8–12, 14–15); however, only the 2-(4-phenylthiazole) analog (15) displayed potent inhibition. Interestingly, several simple phenyl substituted analogs (entry 13) and other differentially substituted phenyl ring analogs (data not shown), failed to show even moderate inhibition of APE1. These results suggest that the thiazole moiety (or analogous heterocycyle) is involved in an essential interaction in the APE1 binding site and should be maintained in some capacity in future analogs. Given that entry 15 had comparable potency to the requisite benzothiazole moiety, a phenyl ring scan of the pendant aryl ring may prove fruitful.
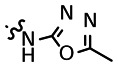
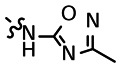
The goal of entries 16–29 was to gain a better understanding of the SAR associated with the N-acetyl moiety of the lead compound 1. As such, a variety of different analogs were prepared, including numerous amides, carbamates, des-acetyl, carboxylic acids, esters, and amide bioisosteres (1,2,4-oxadiazoles and 1,3,4-oxadiazoles). Our first interest was to look at the des-acetyl analog (entry 29); as shown in the above SAR Table, this modification was clearly unfavorable, with a 4-fold loss in activity. Many of the amide analogs resulted in a decrease in potency (e.g. t-Butyl (16) = 25 μM, cyclopropane (17) = 18 μM, CF3 (20) = 31 μM). However, other amide analogs exhibited comparable if not improved potency (e.g. homo-propargyl (24) = 11 μM, CHF2 (22) = 3 μM, and cyclopentane (18) = 11 μM). Replacing the amide with other functional groups, such as a carboxylic acid or ester, resulted in a dramatic loss of potency (data not shown); however, methylcarbamate (21) showed a 2–3-fold improvement in activity over compound 1. We were also eager to explore the tolerance of amide bioisosteres, such as 1,2,4-oxadiazoles and 1,3,4-oxadiazoles. Toward this end, both analogs that lacked the 2-amino group (25 and 26) and those that maintained this moiety (27 and 28) were investigated. Interestingly, both the 1,3,4-oxadiazole (27) and 1,2,4-oxadiazole analog (28) showed comparable activity to the lead compound 1 (16 μM vs. 10 μM), providing the possibility of utilizing such modifications if necessary, based on future pharmacokinetic studies on this class of compounds.
Having explored the various functional groups around the core of the molecule, we then aimed to investigate modifications to the piperidine ring. As shown in Tables 1 and 2, most of these changes we met with limited success; however, a few interesting lessons were learned. Replacing the nitrogen with oxygen (entry 30) or sulfur (entry 31) had a moderate effect on potency, with IC50 values of 18 and 16 μM, respectively. Sulfone derivative 32 (low max response in HTS) and pyridine analog (data not shown) both resulted in a loss of activity. Next, we explored various ring sizes and found that pyrrolidine analogs 34 and 35 displayed 19-fold and 5-fold improvement in potency, respectively, over compound 1 in the radiotracer assay (RIA). In the HTS assay, both compounds had comparable potency; however, the radiotracer incision assay results are considered the “golden standard” for final IC50 determination. It should be noted that this assay is more laborious and very low throughput, so only select compounds are profiled in this system. Differentially substituted piperidine analog 33 displayed lower potency (45 μM); however, the seven-membered ring analogs 36–38 maintained comparable activity to 1.
Compound 34 (ML199) exhibited good potency in the secondary radiotracer assay and gave a favorable ADME profile (see Section 3.6). Furthermore, ML199 was shown to potentiate the toxicity of DNA-damaging agent MMS in a subsequent cell-based assay (Figure 5) while exhibiting only moderate cytotoxicity with the probe compound alone. Mechanism of action of the probe and the original hit were explored, and both compounds were shown to act as competitive inhibitors of APE1 (Figure 6). An electrophoretic mobility shift assay (EMSA), was employed to examine the stability of the APE1-DNA substrate complex in the presence of ML199 (Figure 7). The percent APE1-DNA complex decreased with the increasing concentration of the probe compound, further supporting the notion that ML199 acts by competitive inhibition and binds to Ape1 at the same site as the DNA substrate. On target effect of the probe was explored using HeLa whole cell extract incision assay in which ML199 was shown to inhibit AP Site incision activity which comparable activity as the purified enzyme assay (Figure 8).
SAR Summary
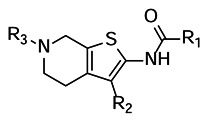
R1 = various groups are tolerated here. (e.g. Me, CHF2, OMe, homopropargyl, amide bioisosteres)
R2 = tight SAR, benzothiazole (and thiazole analogs) preferred. Simple replacement with phenyl group results in complete loss in activity. Removal of benzothiazole also kills activity.
R3 = (ordered in decreasing potency) H ~ Me > Ac ~ isopropyl > Bn > Boc
Piperidine ring changes: (ordered in decreasing potency) pyrrolidine > piperidine ~ azepane > tetrahydropyran ~ tetrahydrothiopyran > differentially substituted piperidine > pyridine
4.1. Comparison to existing art and how the new probe is an improvement
ML199 is more selective inhibitor of APE1 when compared to Compounds 1–4. It is an ideal starting point for further development of the probe as a pre-clinical lead for drug discovery.
4.2. Mechanism of Action Studies
Enzyme Kinetic Studies
Mode of Inhibition: Competitive

Figure 6Kinetic parameters without and with ML199 or Compound 1
Ten pg of APE1 (~28 pM) was incubated without or with 5 μM of the indicated inhibitor at room temperature for 15 min. Increasing concentrations of radiolabeled abasic DNA substrate (i.e. 5, 10, 25, 50, or 100 nM) were then added, and the reactions were incubated at 37 ºC for 5 min before the addition of stop buffer. Intact substrate was separated from incised product on a 15% polyacrylamide denaturing gel, and the percent conversion was determined by standard phosphorimager analysis. Lineweaver – Burk plots of 1/V versus 1/[S] were used to determine KM and kcat (shown). The plotted data points (averages and standard deviations) were derived from 11 independent values for the no inhibitor reactions, and 5 values for each of the inhibitor points.
Interference of APE1-DNA Complex Formation

Figure 7Stability of the APE1-DNA substrate complex in the presence of ML199
(A) Representative EMSA. Three hundred ng of APE1 (~0.8 μM) was incubated without inhibitor (final concentration 1% DMSO) or with the indicated inhibitor (1, 3, 10, 30 or 100 μM) for 10 min on ice. One hundred fmol of abasic DNA substrate (10 nM) was then added, and the binding reaction was incubated on ice for an additional 5 min. At that time, samples were subjected to non-denaturing polyacrylamide gel electrophoresis to separate the APE1-DNA complex (C) from unbound radiolabeled DNA (DNA). Inh = inhibitor. (B) Relative complex formation without (“0”) or with the indicated inhibitor (in μM). Shown is the average and standard deviation of three independent experimental data points, all relative to the APE1 control, without inhibitor.
Inhibition of AP Site Incision Activity of Whole Cell HeLa Extracts

Figure 8Inhibition of HeLa whole cell extract AP site incision activity with ML199
Three hundred ng of HeLa whole cell extract was incubated with 0, 50 or 100 μM of the indicated inhibitor at room temperature for 15 min, prior to the addition of 0.5 pmol radiolabeled AP-DNA substrate and subsequent transfer of the reaction mix (final volume of 10 μL) to 37 ºC for 5 min to allow for incision. Following addition of stop buffer and heat denaturation, the reaction products were subjected to 15% polyacrylamide denaturing gel electrophoresis. Shown is a bar graph reporting the relative percent incision activity in comparison to the no inhibitor control, arbitrarily set at 100. The values reported represent the averages and standard deviation of three independent experimental data points.
4.3. Planned Future Studies
Future studies of this probe molecule include submitting the probe and related analogs to the NCI-60 panel, analysis of the pharmacokinetics (mouse species), and additional pre-clinical experiments, such as Xenograft studies (primarily as a combination therapy with known DNA damaging cancer chemotherapeutics such as TMZ). Additional planned experiments include TMZ potentiation with U-87 glioma line, AP site accumulation studies and isothermal titration calorimetry (ITC) characterization. We plan to submit an extended probe characterization proposal to provide the funds to carry out such studies.
5. References
- 1.
- Wilson DM III, Bohr VA. The mechanics of base excision repair, and its relationship to aging and disease. DNA Repair (Amst). 2007;6:544–559. [PubMed: 17112792]
- 2.
- Wilson DM III, Barsky D. The major human abasic endonuclease: formation, consequences and repair of abasic lesions in DNA. Mutat Res. 2001;485:283–307. [PubMed: 11585362]
- 3.
- Demple B, Sung JS. Molecular and biological roles of APE1 protein in mammalian base excision repair. DNA Repair (Amst). 2005;4:1442–1449. [PubMed: 16199212]
- 4.
- Xanthoudakis S, Smeyne RJ, Wallace JD, Curran T. The redox/DNA repair protein, Ref-1, is essential for early embryonic development in mice. Proc Natl Acad Sci U S A, 1996;93:8919–8923. [PMC free article: PMC38569] [PubMed: 8799128]
- 5.
- Fung H, Demple B. A vital role for ape1/ref1 protein in repairing spontaneous DNA damage in human cells. Mol Cell. 2005;17:463–470. [PubMed: 15694346]
- 6.
- Izumi T, Brown DB, Naidu CV, Bhakat KK, MacInnes MA, Saito H, Chen DJ, Mitra S. Two essential but distinct functions of the mammalian abasic endonuclease. Proc Natl Acad Sci U S A. 2005;102:5739–5743. [PMC free article: PMC556297] [PubMed: 15824325]
- 7.
- Fishel ML, Kelley MR. The DNA base excision repair protein APE1/Ref-1 as a therapeutic and chemopreventive target. Mol Aspects Med. 2007;28:375–395. [PubMed: 17560642]
- 8.
- McNeill DR, Wilson DM III. A dominant-negative form of the major human abasic endonuclease enhances cellular sensitivity to laboratory and clinical DNA-damaging agents. Mol Cancer Res. 2007;5:61–70. [PubMed: 17259346]
- 9.
- Lieberman HB. DNA damage repair and response proteins as targets for cancer therapy. Curr Med Chem. 2008;15:360–367. [PubMed: 18288990]
- 10.
- Zaremba T, Curtin NJ. PARP inhibitor development for systemic cancer targeting. Anticancer Agents Med Chem. 2007;7:515–523. [PubMed: 17896912]
- 11.
- Horton JK, Wilson SH. Hypersensitivity phenotypes associated with genetic and synthetic inhibitor-induced base excision repair deficiency. DNA Repair (Amst). 2007;6:530–543. [PMC free article: PMC1911606] [PubMed: 17113833]
- 12.
- Wyatt MD, Pittman DL. Methylating agents and DNA repair responses: Methylated bases and sources of strand breaks. Chem Res Toxicol. 2006;19:1580–1594. [PMC free article: PMC2542901] [PubMed: 17173371]
- 13.
- Mutter N, Stupp R. Temozolomide: a milestone in neuro-oncology and beyond? Expert. Rev Anticancer Ther. 2006;6:1187–1204. [PubMed: 16925485]
- 14.
- Longley DB, Harkin DP, Johnston PG. 5-fluorouracil: mechanisms of action and clinical strategies. Nat Rev Cancer. 2003;3:330–338. [PubMed: 12724731]
- 15.
- An Q, Robins P, Lindahl T, Barnes DE. 5-Fluorouracil incorporated into DNA is excised by the Smug1 DNA glycosylase to reduce drug cytotoxicity. Cancer Res. 2007;67:940–945. [PubMed: 17283124]
- 16.
- Madhusudan S, Smart F, Shrimpton P, Parsons JL, Gardiner L, Houlbrook S, Talbot D, Hammonds T, Freemont PA, Sternberg MJE, Dianov GL, Hickson ID. Isolation of a small molecule inhibitor of DNA base excision repair. Nucleic Acids Res. 2005;33:4711–4724. [PMC free article: PMC1188083] [PubMed: 16113242]
- 17.
- Seiple LA, Cardellina JH 2nd, Akee R, Stivers JT. Potent inhibition of human apurinic/apyrimidinic endonuclease 1 by arylstilbonic acids. Mol. Pharmacol. 2008;73:669–677. [PMC free article: PMC2720577] [PubMed: 18042731]
- 18.
- Zawahir Z, Dayam R, Deng J, Pereira C, Neamati N. Pharmacophore guided discovery of small-molecule human apurinic/apyrimidinic endonuclease APE1. J. Med. Chem. 2009;52:20–32. [PubMed: 19072053]
- 19.
- Bapat A, Glass LS, Luo M, Fishel ML, Long EC, Georgiadis MM, Kelley MR. Novel small molecule inhibitor of APE1 endonuclease blocks proliferation and reduces viability of glioblastoma cells. J. Pharmacol. Exp. Ther. 2010;334:988–998. [PMC free article: PMC2939666] [PubMed: 20504914]
- 20.
- Simeonov A, Kulkarni A, Dorjsuren D, Jadhav A, Shen M, McNeill DR, Austin CP, Wilson DM III. Identification and characterization of inhibitors of human apurinic/apyrimidinic endonuclease APE1. PLos ONE. 2009;4:e5740. [PMC free article: PMC2685009] [PubMed: 19484131]
- 21.
- Tse W, Boger DL. A Fluorescent Intercalator Displacement Assay for Establishing DNA Binding Selectivity and Affinity. Acc Chem Res. 2004;37(1):61–9. [PubMed: 14730995]
- 22.
- Erzberger JP, Barsky D, Scharer OD, Colvin ME, Wilson DM. III Elements in abasic site recognition by the major human and Escherichia coli apurinic/apyrimidinic endonucleases. Nucleic Acids Res. 1998;26:2771–2778. [PMC free article: PMC147600] [PubMed: 9592167]
- 23.
- Wilson DM III, Takeshita M, Grollman AP, Demple Bs. Incision activity of human apurinic endonuclease (Ape) at abasic site analogs in DNA. J. Biol. Chem. 1995;270:16002–16007. [PubMed: 7608159]
- 24.
- Wilson DM III, Takeshita M, Demple B. Abasic site binding by the human apurinic endonuclease, Ape, and determination of the DNA contact sites. Nucleic Acids Res. 1997;25:933–939. [PMC free article: PMC146540] [PubMed: 9023101]
- 25.
- Gewald K, Schinke E, Böttcher H. 2-Amino-thiophene aus methylenaktiven Nitrile carbonylverbindiungen und Schwefel. Chem. Ber. 1966;99:94–100.
- 26.
- Andersen HS, Olsen OH, Iversen LF, Sorensen ALP, Mortensen SB, Christensen MS, Branner S, Hansen T, Lau JF, Jeppesen L, Moran EJ, Su J, Bakir F, Judge L, Shahbaz M, Collins T, Vo T, newman MJ, Ripka WC, Moller NPH. Discovery and SAR of a Novel Selective and Orally Bioavailable Nonpeptide Classical Competitive Inhibitor Class of Protein-Tyrosine Phosphatase 1B. J. Med. Chem. 2002;45:4443–4459. [PubMed: 12238924]
- PMCPubMed Central citations
- PubChem BioAssay for Chemical ProbePubChem BioAssay records reporting screening data for the development of the chemical probe(s) described in this book chapter
- PubChem SubstanceRelated PubChem Substances
- PubMedLinks to PubMed
- Synthesis, biological evaluation, and structure-activity relationships of a novel class of apurinic/apyrimidinic endonuclease 1 inhibitors.[J Med Chem. 2012]Synthesis, biological evaluation, and structure-activity relationships of a novel class of apurinic/apyrimidinic endonuclease 1 inhibitors.Rai G, Vyjayanti VN, Dorjsuren D, Simeonov A, Jadhav A, Wilson DM 3rd, Maloney DJ. J Med Chem. 2012 Apr 12; 55(7):3101-12. Epub 2012 Mar 28.
- Inhibition of the human apurinic/apyrimidinic endonuclease (APE1) repair activity and sensitization of breast cancer cells to DNA alkylating agents with lucanthone.[Anticancer Res. 2004]Inhibition of the human apurinic/apyrimidinic endonuclease (APE1) repair activity and sensitization of breast cancer cells to DNA alkylating agents with lucanthone.Luo M, Kelley MR. Anticancer Res. 2004 Jul-Aug; 24(4):2127-34.
- Diverse small molecule inhibitors of human apurinic/apyrimidinic endonuclease APE1 identified from a screen of a large public collection.[PLoS One. 2012]Diverse small molecule inhibitors of human apurinic/apyrimidinic endonuclease APE1 identified from a screen of a large public collection.Dorjsuren D, Kim D, Vyjayanti VN, Maloney DJ, Jadhav A, Wilson DM 3rd, Simeonov A. PLoS One. 2012; 7(10):e47974. Epub 2012 Oct 23.
- Review Small-molecule inhibitors of APE1 DNA repair function: an overview.[Curr Mol Pharmacol. 2012]Review Small-molecule inhibitors of APE1 DNA repair function: an overview.Al-Safi RI, Odde S, Shabaik Y, Neamati N. Curr Mol Pharmacol. 2012 Jan; 5(1):14-35.
- Review The DNA base excision repair protein Ape1/Ref-1 as a therapeutic and chemopreventive target.[Mol Aspects Med. 2007]Review The DNA base excision repair protein Ape1/Ref-1 as a therapeutic and chemopreventive target.Fishel ML, Kelley MR. Mol Aspects Med. 2007 Jun-Aug; 28(3-4):375-95. Epub 2007 May 3.
- Small Molecule Inhibitors of the Human Apurinic/apyrimidinic Endonuclease 1 (APE...Small Molecule Inhibitors of the Human Apurinic/apyrimidinic Endonuclease 1 (APE1) - Probe Reports from the NIH Molecular Libraries Program
Your browsing activity is empty.
Activity recording is turned off.
See more...