

NCBI Bookshelf. A service of the National Library of Medicine, National Institutes of Health.
Probe Reports from the NIH Molecular Libraries Program [Internet]. Bethesda (MD): National Center for Biotechnology Information (US); 2010-.

Characterization of a Selective, Reversible Inhibitor of Lysophospholipase 2 (LYPLA2)
Alexander Adibekian, Brent R Martin, Jae Won Chang, Ku-Lung Hsu, Katsunori Tsuboi, Daniel A Bachovchin, Anna E Speers, Steven J Brown, Timothy Spicer, Virneliz Fernandez-Vega, Jill Ferguson, Benjamin F Cravatt, Peter Hodder, and Hugh Rosen.
Author Information and Affiliations
Received: April 8, 2013; Last Update: September 18, 2014.
Protein palmitoylation is an essential post-translational modification necessary for trafficking and localization of regulatory proteins that play key roles in cell growth and signaling. Multiple oncogenes, including HRAS and SRC, require palmitoylation for malignant transformation. Lysophospholipase 1 (LYPLA1) has been identified as a candidate protein palmitoyl thioesterase responsible for HRAS depalmitoylation in mammalian cells. LYPLA1 has a close homolog, LYPLA2 (65% sequence identity), whose substrate specificity and biochemical roles are, as yet, uncharacterized. Seeking chemical tools to investigate biochemical pathway involvement and potential roles in cancer pathogenesis of these enzymes, we conducted a fluorescence polarization-based competitive activity-based protein profiling (fluopol-ABPP) HTS campaign to identify inhibitors of LYPLA1 and LYPLA2. HTS identified a lead triazole urea micromolar inhibitor, which we optimized as dual LYPLA1/LYPLA2 inhibitor ML211, and reversible compounds ML348 and ML349 that act as selective LYPLA1 and LYPLA2 inhibitors, respectively. Using an advanced competitive ABPP strategy employing ABPP probes with controlled reactivity rates, we successfully confirmed potent and selective target engagement of these reversible compounds in living systems as detailed here for ML349 and in the accompanying ML348 Probe Report. Together, these compounds should greatly aid investigations into the biological function of LYPLA1 and LYPLA2.
Assigned Assay Grant #: 1 R01 CA132630
Screening Center Name & PI: The Scripps Research Institute Molecular Screening Center (SRIMSC), H Rosen
Chemistry Center Name & PI: SRIMSC, H Rosen
Assay Submitter & Institution: BF Cravatt, TSRI, La Jolla
PubChem Summary Bioassay Identifier (AID): 2203
Probe Structure & Characteristics

| CID/ML# | Target Name | IC50 (nM) [SID, AID] | Anti-target Name(s) | IC50 (nM) [SID, AID] | Fold Selective† | Secondary Assay(s) Name: IC50 (nM) [SID, AID] |
|---|---|---|---|---|---|---|
| CID 3238952/ML349 | LYPLA2 | 144 [SID 160654496, AID 651990] | LYPLA1 | > 3000 [SID 160654496, AID 651990] | > 20 | Inhibition Assay, HTS hits: [SID 160654495, AID 652029] Selectivity Assay, HTS hits: [SID 160654495, AID 652030] Inhibition and Selectivity Assay SAR: [SID 160654495, AIDs 651988 and 652018] Gel-based ABPP IC50 Assay: 144 nM [SID 160654496, AID 651990] Substrate Kinetic Analysis Assay: IC50 510 nM, Ki 230 nM [SID 160654496, AIDs 652001 and 652003] In Situ Assay: [SID 160654496, AID 651986] In Vivo Assay: [SID 160654496, AID 651985] Cytox assay: [SID 160654496, AID 651991] Gel filtration assay: [SID 160654496, AID 651987] ABPP-SILAC assay: [SID 160654496, AIDs 651981 (in vitro), 651980 (in situ)] |
| > 20 SHs* | > 10,000 [SID 160654495, AID 651988]** | > 69 |
- *
As assessed by gel-based competitive ABPP in a soluble proteome derived from HEK293T cells with the serine hydrolase-specific activity-based probe FP-PEG-Rhodamine.
- **
IC50 of the anti-target is defined as greater than the test compound concentration at which less than or equal to 50% inhibition of the anti-target is observed; as reported in AID 651988, there were no observed anti-targets at the highest test concentration (10,000 nM) so the IC50 is reported as > 10,000 nM.
- †
Fold-selectivity was calculated as: > IC50 for anti-target/IC50 for target.
Recommendations for scientific use of the probe
Protein palmitoylation is an essential post-translational modification (PTM), and identification of enzymes responsible for the dynamic modulation of palmitoylation is paramount to understanding its patho/physiological roles. LYPLA2 is an uncharacterized protein with high sequence similarity to LYPLA1, a serine hydrolase (SH) that we [1] and others [2] have identified as a putative protein palmitoyl thioesterase capable of regulating HRAS palmitoylation in mammalian cells. A principle goal of post-genomic research is the determination of the molecular and cellular roles of uncharacterized enzymes, like LYPLA2, through the development of selective, in vivo-active chemical tools. The probe described herein, ML349, can selectively inhibit LYPLA1 in vitro (complex proteome lysates), in situ (cells in culture), and in vivo (mouse animal models). Along with the dual LYPLA1/LYPLA2 probe ML211 and LYPLA1-selective probe ML348 (see respective Probe Reports), ML349 is intended for use in primary research studies aimed at elucidating the patho/physiological roles of the LYPLA2 and LYPLA1 in living system.
1. Introduction
Protein palmitoylation is an essential PTM necessary for trafficking and localization of regulatory proteins that play key roles in cell growth and signaling. Numerous proteins have been identified as targets of palmitoylation, including cytoskeletal proteins, kinases, receptors, and other proteins involved in various aspects of cellular signaling and homeostasis [3]. Using a global chemo-proteomic method for the metabolic incorporation and identification of palmitoylated proteins, we have been able to identify hundreds of palmitoylated proteins, revealing palmitoylation as a widespread PTM [1]. Palmitoylation involves an acyl-thioester linkage to specific cysteines [4, 5]. Given the labile properties of thioesters, palmitoylation is potentially reversible and may be regulated in a manner analogous to other PTMs (e.g., phosphorylation). As such, identification of proteins responsible for the dynamic modulation of palmitoylation is paramount to understanding its patho/physiological roles. For example, multiple oncogenes, including HRAS and SRC, require palmitoylation-mediated localization for signaling and subsequent malignant transformation [6]. It has been suggested by Waldmann et al. that preventing depalmitoylation of RAS by inhibiting thioesterase activity may disrupt targeted distribution (e.g., to Golgi), thereby downregulating oncogenic signaling [2]. This suggests that inhibitors of protein palmitoyl thioesterases may act as tumor suppressors by preventing aberrant growth signaling. More than a decade ago, the cytosolic serine hydrolase (SH) acyl-protein thioesterase 1 (APT1) was identified as an in vitro HRAS palmitoyl thioesterase [7]. Initially classified as lysophospholipase 1 (LYPLA1) [8], the enzyme has since been demonstrated to have several hundred-fold higher activity as a protein palmitoyl thioesterase. While the in vitro data [7, 9] provided an intriguing clue to its possible role in vivo, much less is known about the in vivo thioesterase activity of LYPLA1. LYPLA2 (a.k.a. APT2) is 65% identical to LYPLA1, and also exhibits lysophospholipase activity in vitro, but its potential role as a thioesterase is unknown [10]. shRNA knockdown studies of LYPLA2 revealed only partial knockdown of the enzyme, making substrate identification inconclusive (unpublished). A principle goal of post-genomic research is the determination of the molecular and cellular role of uncharacterized enzymes like LYPLA1 and LYPLA2. Small molecule inhibitors would be of particular utility when combined with global methods for profiling dynamic palmitoylation [1, 11] for investigation of LYPLA1/LYPLA2 biology.
Following a MLPCN HTS inhibitor discovery campaign (AIDs 2174, 2177, 2232, and 2233), we previously reported a LYPLA1/LYPLA2 dual inhibitor, ML211, based on an irreversible triazole urea scaffold. In the same screen, we also identified reversible compounds ML349 and ML348 that showed high selectivity for LYPLA2 and LYPLA1, respectively [12].
Several inhibitors of LYPLA1 have been described [2, 13, 14] (see Section 4.1 for structures and further discussion), but none of these agents have proven capable of selectively inhibiting LYPLA1 activity in living systems, and no selective inhibitors of LYPLA2 have been reported to date. To comprehensively identify LYPLA1 and LYPLA2 substrates and functionally test the role of these enzymes in dynamic palmitoylation and tumorigenesis, development of high affinity and selective inhibitors capable of achieving temporal and more complete control over activity is critical.
As SHs, catalytically active LYPLA1 and LYPLA2 are readily labeled by fluorescent activity-based protein profiling (ABPP) probes bearing a fluorophosphonate (FP) reactive group [15]. This reactivity can be exploited for inhibitor discovery using a competitive-ABPP platform, whereby small molecule enzyme inhibition is assessed by the ability to out-compete ABPP probe labeling [16]. Competitive ABPP has also been configured to operate in a high-throughput manner via fluorescence polarization readout, fluopol-ABPP [17]. In conjunction with the SRIMSC, we applied fluopol-ABPP to LYPLA1 and LYPLA2 inhibitor discovery. As mentioned above, initial efforts focused on deriving a dual LYPLA1/2 inhibitor based on a triazole urea scaffold. The probe ML211 inhibits both target enzymes with low nanomolar potency and is active in situ. Because ML211 operated by an irreversible mechanism, confirming target engagement in living systems was a comparatively straightforward process using a competitive ABPP strategy. However, the analogous characterization of reversible compounds is typically a more challenging endeavor. As such, to fully characterize the reversible probes ML349 and ML348, we utilized kinetically-tuned, in vivo-active ABPP probes that allowed direct profiling of reversible inhibitors. By controlling reactivity rates, these ABPP probes minimized false negative results from inhibitors outcompeting ABPP probe labeling, thus enhancing detection of target (and anti-target) engagement [12]. As detailed herein, ML349 is highly potent against LYPLA2 (IC50 of 144 nM in vitro) and is the first reported selective LYPLA2 inhibitor. ML349 exhibited high selectivity (>20-fold) vs. LYPLA1 and all other (∼20) SHs assessed by gel-based competitive ABPP. In-depth profiling by quantitative MS-based methods confirmed selectivity among the SH superfamily, designating ML349 as a promising chemical tool for investigation of LYPLA2 biology.
2. Materials and Methods
All reagents for chemical synthesis were purchased from Sigma-Aldrich, Acros, Fisher, Fluka, ChemDiv, or Aurora and used without further purification. Dry solvents were obtained by passing commercially available pre-dried, oxygen-free formulations through activated alumina columns. All reactions were carried out under a nitrogen atmosphere using oven-dried glassware. Flash chromatography was performed using 230-400 mesh silica gel. NMR spectra were recorded on a Varian Inova-400 spectrometer and were referenced to trimethylsilane (TMS) or the residual solvent peak. Chemical shifts are reported in ppm relative to TMS and J values are reported in Hz. High resolution mass spectrometry (HRMS) experiments were performed at TSRI Mass Spectrometry Core on an Agilent mass spectrometer using electrospray ionization-time of flight (ESI-TOF). All other protocols are summarized below.
2.1. Assays
Solubility in PBS: The solubility of compounds are tested in triplicate in phosphate buffered saline (PBS), pH 7.4. per well, 198 µl PBS is added to a Millipore Solvinert Hydrophilic PTFE 96 well filter plate: pore size: 0.45um (MSRLN0450). Test compounds are introduced from 10 mM DMSO stock solutions (2 µl). The final concentration of DMSO was 1 percent. Samples are allowed to incubate at 22 ºC for 18 hours. In the morning the plate is centrifuged where the soluble portion passes through the filter and is collected in a capture plate. Clotrimazole is included as a control to assure the assay is working properly. The samples are analyzed by HPLC. Peak area is compared to a standard of known concentration. In cases when the concentration was too low for UV analysis or when the compound did not possess a good chromophore, LC-MS-MS analysis is used.
Solubility in Media: The solubility of compounds are tested in triplicate in complete media (DMEM + 10% FBS). Per well, 198 µL PBS is added to a Millipore Solvinert Hydrophilic PTFE 96 well filter plate: pore size: 0.45 um (MSRLN0450). Test compounds are introduced from 10 mM DMSO stock solutions (2 µL). The final concentration of DMSO was 1 percent. Samples are allowed to incubate at 22 ºC for 18 hours. In the morning the plate is centrifuged where the soluble portion passes through the filter and is collected in a capture plate. The samples are analyzed by HPLC (Agilent 1100 with diode-array detector). Peak area is compared to a standard of known concentration. In cases when the concentration was too low for UV analysis or when the compound did not possess a good chromophore, LC-MS-MS analysis is used.
Stability in PBS: Demonstration of stability in PBS was conducted by addition of 10 µM compound from a DMSO stock to PBS in HPLC autosampler vials. Samples are held in the HPLC autosampler at ambient temperature. At approximately 0, 1, 2, 4, 8, 24, and 48 hours the samples are injected on the HPLC. Peak area and retention time are compared between injections. Data is log transformed and represented as half-life. DMSO is added as a co-solvent as needed for solubility.
Determination of Glutathione reactivity: Compound (10 µM) is incubated at 37 °C for 6 hours in the presence of 50 µM freshly prepared reduced glutathione. At 0 and 6 hours the samples are injected on the HPLC. Peak area and retention time are compared between injections. Samples are evaluated for a glutathione dependent decrease in compound concentration. DMSO is added as a co-solvent as needed for solubility.
Primary Assays
Primary uHTS assay to identify LYPLA2 inhibitors (AID 2177)
Assay Overview: The purpose of this assay was to identify compounds that act as LYPLA2 inhibitors. This assay also serves as a counterscreen for a set of previous experiments entitled, “Fluorescence polarization-based primary biochemical high throughput screening assay to identify inhibitors of Protein Phosphatase Methylesterase 1 (PME-1)" (AID 2130). This competitive activity-based protein profiling (ABPP) assay uses fluorescence polarization to investigate enzyme-substrate functional interactions based on active site-directed molecular probes [3, 15]. A serine hydrolase-specific fluorophosphonate-rhodamine (FP-Rh) probe, which broadly targets enzymes from the serine hydrolase family [14] was used to label LYPLA2 in the presence of test compounds. The reaction was excited with linear polarized light and the intensity of the emitted light was measured as the polarization value (mP). As designed, test compounds that act as LYPLA2 inhibitors will prevent LYPLA2-probe interactions, thereby increasing the proportion of free (unbound) fluorescent probe in the well, leading to low fluorescence polarization. Omission of enzyme (which gives the same result as use of a catalytically-dead enzyme) serves as a positive control. Compounds were tested at a nominal concentration of 5.9 µM.
Protocol Summary: Prior to the start of the assay, Assay Buffer (4.0 µL; 0.01% Pluronic acid, 50 mM Tris HCl pH 8.0, 150 mM NaCl, 1mM DTT) containing LYPLA2 protein (9.38 nM) was dispensed into 1536-well microtiter plates. Next, test compound (30 nL in DMSO) or DMSO alone (0.59% final concentration) was added to the appropriate wells and incubated for 30 minutes at 25 °C. The assay was started by dispensing FP-Rh probe (1.0 µL of 375 nM in Assay Buffer) to all wells. Plates were centrifuged and, after 10 minutes of incubation at 25 °C, fluorescence polarization was read on a Viewlux microplate reader (PerkinElmer, Turku, Finland) using a BODIPY TMR FP filter set and a BODIPY dichroic mirror (excitation = 525 nm, emission = 598 nm). Fluorescence polarization was read for 15 seconds for each polarization plane (parallel and perpendicular). The well fluorescence polarization value (mP) was obtained via the PerkinElmer Viewlux software. Assay Cutoff: Compounds that inhibited LYPLA2 greater than 25.78% (mean + 3 x standard deviation) were considered active.
Confirmation uHTS assay to identify LYPLA2 inhibitors (AID 2232)
Assay Overview: The purpose of this assay was to confirm activity of compounds identified as active in the primary uHTS screen (AID 2177). In this assay, the FP-Rh probe was used to label LYPLA2 in the presence of test compounds and analyzed as described above (AID 2177). Compounds were tested in triplicate at a nominal concentration of 5.9 µM.
Protocol Summary: The assay was performed as described above (AID 2177), except that compounds were tested in triplicate. Assay Cutoff: Compounds that inhibited LYPLA2 greater than 25.78% were considered active.
Secondary Assays
Inhibition of LYPLA2 by top HTS hits (AID 652029)
Assay Overview: The purpose of this assay is to determine whether test compounds can inhibit LYPLA2 in a complex proteomic lysate using a competitive activity-based proteomic profiling (ABPP) assay. In this assay, a complex proteome, containing spiked-in recombinant form of LYPLA2 is incubated with test compound followed by reaction with a serine-hydrolase-specific rhodamine-conjugated fluorophosphonate (FP-Rh) activity-based probe. The reaction products are separated by SDS-PAGE and visualized in-gel using a flatbed fluorescence scanner. The percentage activity remaining is determined by measuring the integrated optical density of the bands. As designed, test compounds that act as LYPLA2 inhibitors will prevent enzyme-probe interactions, thereby decreasing the proportion of bound fluorescent probe, giving lower fluorescence intensity in the band in the gel. Percent inhibition is calculated relative to a DMSO (no compound) control.
Protocol Summary: To soluble proteome prepared from mouse brain (1 mg/ml in DPBS) is added 20 nM purified recombinant human (rh) LYPLA2. Proteome was treated with 20 µM test compound (1 µL of a 50x stock in DMSO) for 30 minutes at 25 ºC (50 µL reaction volume). FP-Rh (1 µL of 50x stock in DMSO) was added to a final concentration of 2 µM. The reaction was incubated for 30 minutes at 25 ºC, quenched with 2x SDS-PAGE loading buffer, separated by SDS-PAGE and visualized by in-gel fluorescent scanning. The percentage activity remaining was determined by measuring the integrated optical density of the target rhLYPLA2 band relative to a DMSO-only (no compound) control. Assay Cutoff: Compounds with greater than or equal to 50% inhibition were considered active.
Inhibition of LYPLA2 and selectivity vs. LYPLA1 of top HTS hits (AID 652030)
Assay Overview: The purpose of this assay is to determine whether test compounds can inhibit LYPLA2 in a complex proteomic lysate and assess selectivity vs. LYPLA1 using a competitive activity-based proteomic profiling (ABPP) assay. In this assay, a complex proteome, containing spiked-in recombinant form of LYPLA2 is incubated with test compound followed by reaction with a serine-hydrolase-specific rhodamine-conjugated fluorophosphonate (FP-Rh) activity-based probe. The reaction products are separated by SDS-PAGE and visualized in-gel using a flatbed fluorescence scanner. The percentage activity remaining is determined by measuring the integrated optical density of the bands. As designed, test compounds that act as LYPLA2 inhibitors will prevent enzyme-probe interactions, thereby decreasing the proportion of bound fluorescent probe, giving lower fluorescence intensity in the band in the gel. Percent inhibition is calculated relative to a DMSO (no compound) control.
Protocol Summary: To membrane proteome prepared from mouse brain (1 mg/ml in DPBS) is added 20 nM purified recombinant human (rh) LYPLA2. Proteome was treated with 10 µM test compound (1 µL of a 50x stock in DMSO) for 30 minutes at 25 ºC (50 µL reaction volume). FP-Rh (1 µL of 50x stock in DMSO) was added to a final concentration of 2 µM. The reaction was incubated for 30 minutes at 25 ºC, quenched with 2x SDS-PAGE loading buffer, separated by SDS-PAGE and visualized by in-gel fluorescent scanning. The percentage activity remaining was determined by measuring the integrated optical density of the target rhLYPLA2 band relative to a DMSO-only (no compound) control. Assay Cutoff: Compounds with greater than or equal to 30% inhibition were considered active.
Gel-based competitive ABPP analysis of reversible (AID 651988) and triazole urea (AID 652018) SAR libraries
Assay Overview: The purpose of this assay is to determine whether powder samples of test compounds can inhibit LYPLA2 and LYPLA1 in a complex proteomic lysate and to estimate compound selectivity in a competitive activity-based protein profiling (ABPP) assay. In this assay, a complex proteome is incubated with test compound followed by reaction with the serine-hydrolase-specific rhodamine-conjugated fluorophosphonate (FP-PEG-Rh) activity-based probe. FP-PEG-Rh is similar to FP-Rh, but shows slower reaction kinetics, facilitating analysis of target inhibition by reversible compounds [12]. The reaction products are separated by SDS-PAGE and visualized in-gel using a flatbed fluorescence scanner. The percentage activity remaining is determined by measuring the integrated optical density of the bands. As designed, test compounds that act as LYPLA2 and/or LYPLA1 inhibitors will prevent enzyme-probe interactions, thereby decreasing the proportion of bound fluorescent probe, giving lower fluorescence intensity in the band in the gel. Percent inhibition is calculated relative to a DMSO (no compound) control.
Protocol Summary: Soluble proteome (50 µL of 1 mg/ml in DPBS) of HEK293T cells was treated with 300 nM, 1 µM, or 10 µM test compound (1 µL of a 50x stock in DMSO). Test compounds were incubated for 30 minutes at 37 °C. FP-PEG-Rh (1 µL of 50x stock in DMSO) was added to a final concentration of 5 µM. The reaction was incubated for 30 minutes at 25 °C, quenched with 2x SDS-PAGE loading buffer, separated by SDS-PAGE and visualized by in-gel fluorescent scanning. The percentage activity remaining was determined by measuring the integrated optical density of the LYPLA2 and LYPLA1 bands relative to a DMSO-only (no compound) control. From among the 20+ other distinct bands visible, anti-targets are only listed if greater than or equal to 50% inhibition is observed at any concentration tested. Assay Cutoff: Compounds with greater than or equal to 50% inhibition at 300 nM were considered active.
Determination of IC50 values for LYPLA2 and LYPLA1 by competitive ABPP (AID 651990)
Assay Overview: The purpose of this assay is to determine IC50 values of powder samples of test compounds for LYPLA2 and LYPLA1 in a complex proteomic lysate using a competitive activity-based protein profiling (ABPP) assay. In this assay, a complex proteome is incubated with test compound followed by reaction with the serine-hydrolase-specific rhodamine-conjugated fluorophosphonate (FP-PEG-Rh) activity-based probe. FP-PEG-Rh is similar to FP-Rh, but shows slower reaction kinetics, facilitating analysis of target inhibition by reversible compounds [12]. The reaction products are separated by SDS-PAGE and visualized in-gel using a flatbed fluorescence scanner. The percentage activity remaining is determined by measuring the integrated optical density of the bands. As designed, test compounds that act as LYPLA2 and/or LYPLA1 inhibitors will prevent enzyme-probe interactions, thereby decreasing the proportion of bound fluorescent probe, giving lower fluorescence intensity in the band in the gel. Percent inhibition is calculated relative to a DMSO (no compound) control.
Protocol Summary: Soluble proteome (50 µL of 1 mg/ml in DPBS) of HEK293T cells was treated with varying concentrations of test compound (1 µL of a 50x stock in DMSO) for 30 minutes at 37 °C. FP-PEG-Rh (1 µL of 50x stock in DMSO) was added to a final concentration of 5 µM. The reaction was incubated for 30 minutes at 25 °C, quenched with 2x SDS-PAGE loading buffer, separated by SDS-PAGE and visualized by in-gel fluorescent scanning. The percentage activity remaining was determined by measuring the integrated optical density of the LYPLA2 and LYPLA1 bands relative to a DMSO-only (no compound) control. IC50 values were determined from dose-response curves from three replicates at each inhibitor concentration: 3000 nM to 1000 nM, 300 nM to 100 nM, 30 nM, and 1 nM. Assay Cutoff: Compounds with an IC50 less than or equal to 500 nM were considered active.
Kinetic analysis of inhibition of LYPLA2 (AID 652001) and LYPLA1 (AID 652003) by substrate assay
Assay Overview: The purpose of this assay is to determine kinetic parameters (Vmax, Km, Ki, and IC50 values) for powder samples of test compounds that act as reversible inhibitors for LYPLA2 and LYPLA1 using a fluorogenic substrate (resorufin acetate)-based assay. To determine Vmax and Km values, LYPLA2 or LYPLA1 is incubated with varying concentrations of substrate and the rate of enzymatic hydrolysis (as indicated by fluorescence intensity) is monitored as a function of time. Initial velocities for each substrate concentration are determined and used to calculate Vmax and Km using standard Michaelis-Menten kinetics. To obtain IC50 values, LYPLA2 or LYPLA1 is incubated with varying concentrations of inhibitor at a fixed substrate concentration, and fluorescence intensity is monitored as a function of time. Initial velocities determined for each inhibitor concentration are used to calculate IC50 values. From these data, Ki values can be calculated using the Cheng-Prusoff equation. For all assays, enzyme activity is calculated relative to a catalytically-dead (LYPLA2- S122A or LYPLA1-S119A) enzyme control.
Protocol Summary: Substrate resorufin acetate was dissolved in DMSO. Active or catalytically-dead enzyme solutions (10 nM) were prepared in DPBS adjusted to pH 6.5 with sodium acetate and 0.2% pluronic F127. In a black-bottom half-area 96 well plate, 5 µL of substrate was aliquoted at varying concentrations (LYPLA2: 200 µM, 180 µM, 160 µM, 140 µM, 100 µM, 80 µM, 40 µM, 30 µM, 20 µM, 17.5 µM, 15 µM, 12.5 µM, 10 µM, 7.5 µM, 5 µM, 2.5 µM, 0 µM ; LYPLA1: 180 µM, 140 µM, 100 µM, 70 µM, 60 µM, 50 µM, 35 µM, 25 µM, 15 µM, 7.5 µM, 3.75 µM, 0 µM). The assay was initiated upon addition of enzyme (95 µL of 10 nM) using a multi-channel pipette, and reactions quickly mixed by pipetting up and down several times. Fluorescence intensity was measured on a Tecan F500 plate reader at room temperature every 30 seconds using a 525/35 nM excitation filter, a 600/10 nM emission filter, and a 560 LP dichroic filter. Each concentration was performed as 4 separate replicates for both the active and dead enzymes. After subtracting background (average fluorescence intensity of catalytically-dead enzyme at each time point for each assay condition), fluorescence intensity was plotted vs. time and initial velocities were calculated using standard straight-line plots (with non-linear regression) in GraphPad Prism using the first ∼6 minutes of the reaction. The initial velocities (+/- SEM, plotted vs. substrate concentration) were analyzed using standard Michaelis-Menten kinetics (GraphPad Prism) to derive the Vmax and Km values. Software-generated values and SEM are reported.
To calculate the Ki values, the same experimental setup was used. Active or catalytically-dead enzyme (10 nM) was incubated with varying inhibitor concentrations (LYPLA2: 10 µM, 6 µM, 4 µM, 2 µM, 1 µM, 0.8 µM, 0.6 µM, 0.4 µM, 0.2 µM, 0.1 µM, 0.05 µM, 0 µM ; LYPLA1: 11-point 2-fold dilution series from 25 µM to 24 nM, 0 nM) for 15 minutes (95 µL total volume), and then aliquoted into 96-well plate wells containing a fixed concentration of resorufin acetate substrate (LYPLA2: 30 µM, 5 µL; LYPLA1: 50 µM, 5 µL). Fluorescence intensity was monitored as described above. After background subtraction, the initial velocities were calculated as described above, plotted vs. inhibitor concentration, and analyzed to derive IC50 values (standard one phase decay, GraphPad Prism). Software-generated values and SEM are reported. The Ki values were calculated using the Cheng-Prusoff equation. Assay Cutoff: Compounds with an IC50 value of less than or equal to 10 µM were considered active.
Analysis of Cytotoxicity (AID 651991)
Assay Overview: The purpose of this assay is to determine cytotoxicity of powder samples of test compounds. In this assay, HEK293T cells in either serum-free medium or medium containing fetal calf serum (FCS) are incubated with test compounds, followed by determination of cell viability. The assay utilizes the WST-1 substrate which is converted into colorimetric formazan dye by the metabolic activity of viable cells. The amount of formed formazan directly correlates to the number of metabolically active cells in the culture. As designed, compounds that reduce cell viability will result in decreased absorbance of the dye.
Protocol Summary: This assay was started by dispensing HEK293T in DMEM medium supplemented with 10% FCS (100 µL, 15,000 cells/well) into a 96-well plate. Cells were incubated for 24 hours at 37 °C in a humidified incubator, medium was removed, and 100 µL of fresh, serum-free medium or medium supplemented with 10% FCS was added. Compound (10 µL of 11x stocks in medium containing 10% DMSO) or an equal volume medium containing 10% DMSO only was added to each well. Cells were incubated for 48 hours at 37 °C in a humidified incubator and cell viability was determined by the WST-1 assay (Roche) according to manufacturer instructions. CC50 values were determined from dose-response curves from six replicates at each inhibitor concentration (50000, 10000, 2000, 400, 80, 16, and 3.2 nM). Assay Cutoff: Compounds with CC50 values less than or equal to 10 µM were considered active (cytotoxic).
Gel filtration to assess mode of action (AID 651987)
Assay Overview: The purpose of this assay is to determine whether powder samples of test compounds inhibit LYPLA2 and LYPLA1 in a reversible or irreversible manner. In this assay, a complex proteome is incubated with test compound and a fraction of the assay mixture is passaged over a Sephadex G-25M column before reaction with the serine-hydrolase-specific fluorophosphonate-PEG-rhodamine (FP-PEG-Rh) probe. FP-PEG-Rh is similar to FP-Rh, but shows slower reaction kinetics, facilitating analysis of target inhibition by reversible compounds [12]. The reaction products are separated by SDS-PAGE and visualized in-gel using a flatbed fluorescence scanner. The percentage activity remaining is determined by measuring the integrated optical density (IOD) of the bands relative to a DMSO (no compound) control. As designed, test compounds that act as irreversible inhibitors will prevent enzyme-probe interactions both before and after gel filtration, leading to low fluorescence intensity in the band in the gel. In contrast, compounds that act as reversible inhibitors will show recovery of probe labeling (and higher fluorescence intensity in the band in the gel) following gel filtration to remove small molecules from the sample.
Protocol Summary: Soluble proteome (2 mL of 1 mg/ml in DPBS) of HEK293T cells was treated with 10 µM or 20 µM test compound (50x stock in DMSO) or DMSO (control). Test compounds were incubated for 30 minutes at 37 °C. An aliquot (50 µL) was removed from each reaction, and the remaining sample was passaged over a Sephadex G-25M column 1, 2, or 3x, with an aliquot (50 µL) set aside after each passage. Aliquot volumes were adjusted to equalize protein concentrations across all samples and reacted with FP-PEG-Rh (50x stock in DMSO; 5 µM final concentration). The reaction was incubated for 30 minutes at 25 °C, quenched with 2x SDS-PAGE loading buffer, separated by SDS-PAGE and visualized by in-gel fluorescent scanning. The percentage activity remaining was determined by measuring the integrated optical density of the LYPLA2 and LYPLA1 bands relative to a DMSO-only (no compound) control. Assay Cutoff: Compounds were designated as reversible inhibitors if they exhibited greater than or equal to 50% recovery of probe labeling following gel filtration. Compounds were designated as irreversible inhibitors if they exhibited less than 50% recovery of probe labeling following gel filtration.
In situ inhibition of LYPLA2 and LYPLA1 by competitive ABPP (AID 651986)
Assay Overview: The purpose of this assay is to determine whether or not powder samples of test compounds can inhibit LYPLA2 and LYPLA1 in situ. In this assay, cultured HEK293T cells or BW5147-derived murine T-cells are incubated with test compound followed by the cell-permeable alkyne-functionalized triazole urea ABPP probe NHU5 [12]. NHU5 covalently reacts with a subset of serine hydrolases, including LYPLA2 and LYPLA1, and shows slower reaction kinetics than other cell-permeable serine hydrolase-specific ABPP probes (e.g., FP-alkyne), facilitating analysis of target inhibition by reversible compounds. Cells are harvested, homogenized, and reacted with a rhodamine-functionalized azide tag under copper(I)-catalyzed azide-alkyne cycloaddition (“click chemistry”) reaction conditions to allow visualization of probe-tagged proteins. The reaction products are separated by SDS-PAGE and visualized in-gel using a flatbed fluorescence scanner. The percentage activity remaining is determined by measuring the integrated optical density of the bands. As designed, test compounds that act as LYPLA2 and/or LYPLA1 inhibitors will prevent enzyme-probe interactions, thereby decreasing the proportion of bound, fluorescent-tagged probe, giving lower fluorescence intensity in the band in the gel.
Protocol Summary: HEK293T cells were grown in DMEM medium (supplemented with 10% FCS and 1x Penicillin/Streptomycin/Glutamine solution) and BW5147-derived murine T-cell hybridoma cells were grown in RPMI-1640 medium (supplemented with 10% FCS and 1x Penicillin/Streptomycin/Glutamine solution) at 37 °C in a humidified incubator (5% CO2 atmosphere). Test compounds (5 µM final concentration) or DMSO only were directly added to the cell culture medium. After 3 hours, the cell-permeable, alkyne-functionalized probe NHU5 (50 µM final concentration) was added. After 1 hour, cells were washed (4x DPBS), harvested, isolated by centrifugation at 1,400 x g for 3 minutes, re-suspended in methanol/chloroform/dH2O (4:1:3 v/v), and vortexed. After centrifugation at 13,000 x g for 3 minutes, the upper layer was removed and 3 volumes of methanol were added and the solution vortexed. Protein was pelleted by centrifugation at 13,000 x g for 6 minutes. The supernatant was removed and the pellet was air-dried and re-suspended in PBS by sonication. For visualization of probe-labeled proteins, click chemistry with a rhodamine-azide tag (Rh-N3; 100 µM) was carried out under standard conditions (1 mM TCEP, 100 µM TBTA ligand, 1 mM Cu(II)sulfate, 1 hour, 25 °C) to append the rhodamine fluorophore to the alkyne-functionalized NHU5 probe. Reactions were quenched with 2x SDS-PAGE loading buffer, separated by SDS-PAGE and visualized by in-gel fluorescent scanning. The percentage activity remaining was determined by measuring the integrated optical density of the bands relative to a DMSO-only (no compound) control. Assay Cutoff: Compounds with greater than or equal to 50% inhibition were considered active.
In vivo inhibition of LYPLA2 and LYPLA1 by competitive ABPP (AID 651985)
Assay Overview: The purpose of this assay is to determine whether or not powder samples of test compounds can inhibit LYPLA2 and LYPLA1 in vivo. In this assay, test compounds are administered to mice followed by the in vivo active alkyne-functionalized triazole urea ABPP probe NHU5 [12]. NHU5 covalently reacts with a subset of serine hydrolases, including LYPLA2 and LYPLA1, and shows slower reaction kinetics than other in vivo active serine hydrolase-specific ABPP probes (e.g., FP-alkyne), facilitating analysis of target inhibition by reversible compounds. Mice are sacrificed, and their tissues harvested, homogenized, and the soluble fraction isolated and reacted with a rhodamine-functionalized azide tag under copper(I)-catalyzed azide-alkyne cycloaddition (“click chemistry”) reaction conditions to allow visualization of probe-tagged proteins. The reaction products are separated by SDS-PAGE and visualized in-gel using a flatbed fluorescence scanner. The percentage activity remaining is determined by measuring the integrated optical density of the bands. As designed, test compounds that act as inhibitors will prevent enzyme-probe interactions, thereby decreasing the proportion of bound, fluorescent-tagged probe, giving lower fluorescence intensity in the band in the gel.
Protocol Summary: Test compounds were prepared as a homogeneous PEG solution by vortexing and sonicating neat compound directly into PEG300. Purpose-bred C57-black laboratory mice (<6 months old, 20–28 g) were i.p. administered with test compound (50 mg/kg; 4µL/g) or vehicle only and, after 3 hours, with NHU5 probe (PEG solution; 100 mg/kg). After 1 hour, mice were sacrificed, and tissues were removed and Dounce-homogenized directly in methanol /chloroform/dH2O (4:1:3 v/v). After centrifugation at 13,000 x g for 3 minutes, the upper layer was removed and 3 volumes of methanol were added and solution vortexed. Protein was pelleted by centrifugation at 13,000 x g for 6 minutes. The supernatant was removed and the pellet was air-dried and re-suspended in PBS by sonication. For visualization of probe-labeled proteins, click chemistry with a rhodamine-azide tag (Rh-N3; 100 µM) was carried out under standard conditions (1 mM TCEP, 100 µM TBTA ligand, 1 mM Cu(II)sulfate) to append the rhodamine fluorophore to the alkyne-functionalized NHU5 probe. Reactions were quenched with 2x SDS-PAGE loading buffer, separated by SDS-PAGE and visualized by in-gel fluorescent scanning. The percentage activity remaining was determined by measuring the integrated optical density of the bands relative to a DMSO-only (no compound) control. Assay Cutoff: Compounds with greater than or equal to 50% inhibition in one or more tissues tested were considered active.
Selectivity analysis by ABPP-SILAC in vitro (AID 651981)
Assay Overview: The purpose of this assay is to determine the selectivity profile of powder samples of test compounds using stable isotope labeling with amino acids in cell culture (SILAC) activity-based protein profiling (ABPP) in vitro. In this assay, cultured BW5147-derived murine T-cells are metabolically labeled with light or heavy amino acids. Cells are harvested, homogenized, and proteome fractions isolated. Light and heavy samples are treated with inhibitor and DMSO, respectively, followed by the serine-hydrolase-specific ABPP affinity probe fluorophosphonate-PEG-biotin (FP-PEG-biotin). FP-PEG-biotin is similar to FP-biotin, but shows slower reaction kinetics, facilitating analysis of target inhibition by reversible compounds. Light and heavy samples are combined in a 1:1 (w/w) ratio, and biotinylated proteins are enriched, trypsinized, and analyzed by LC/LC-MS/MS (MudPIT). Inhibition of target and anti-target activity is quantified by comparing intensities of light and heavy peptide peaks. As designed, compounds that act as inhibitors will block FP-PEG-biotin labeling, reducing enrichment in the inhibitor-treated (light) sample relative to the DMSO-treated (heavy) sample, giving a smaller light/heavy ratio for each protein. Proteins not targeted by inhibitors would be expected to have a ratio close to 1.
Sample Preparation. BW5147-derived murine T-cell hybridoma cells were initially grown for 6 passages in either light or heavy SILAC RPMI 1640 medium supplemented with 10% dialyzed FCS and 1x PenStrep Glutamine. Light medium was supplemented with 100 µg/mL L-arginine (Sigma) and 100 µg/mL L-lysine (Sigma). Heavy medium was supplemented with 100 µg/mL [13C615N4]-L-Arginine (Isotek) and 100 µg/mL [13C615N2]-L-Lysine (Isotek). Cells were harvested and homogenized by sonication in DPBS. The soluble and membrane fractions were isolated by centrifugation (100K x g, 45 minutes) and the protein concentration was adjusted to 1 mg/mL with DPBS. Membrane and soluble fractions of light cells were treated with test compound (1 µM) and membrane and soluble fractions of heavy cells were treated with DMSO for 30 minutes at 37 °C. All samples were reacted with the activity-based affinity probe FP-PEG-Biotin (5 µM) for 30 minutes at 25 °C. Light and heavy proteomes were mixed in 1:1 (w/w) ratio to generate one membrane and one soluble sample, which were desalted over PD-10 columns (GE Healthcare). SDS was added to a final concentration of 0.5% in 3 mL total reaction volume and biotinylated proteins were enriched on streptavidin beads (50 µL, 1 hour, 25 °C). The beads were washed with 1% SDS in DPBS (1x), 6M urea (1x), and DPBS (2x), then resuspended in 6 M urea (150 µL), reduced with 5 mM TCEP for 20 minutes, and alkylated with 10 mM iodoacetamide for 30 minutes at 25 °C in the dark, and urea concentration was reduced to 2 M with 2x volume DPBS. On-bead digestions were performed for 12 hours at 37 °C with sequence-grade modified trypsin (Promega; 2 µg) in the presence of 2 mM CaCl2. Peptide samples were acidified to a final concentration of 5% (v/v) formic acid and stored at -80 °C prior to analysis.
LC-MS/MS analysis. Samples were analyzed by multidimensional liquid chromatography tandem mass spectrometry (MudPIT) using an Agilent 1100-series quaternary pump and Thermo Scientific LTQ Orbitrap ion trap mass spectrometer. Peptides were eluted in a 5-step MudPIT experiment using 0%, 25%, 50%, 80%, and 100% salt bumps of 500 mM aqueous ammonium acetate and data were collected in data-dependent acquisition mode with dynamic exclusion turned on (60 s, repeat of 1). Specifically, one full MS (MS1) scan (400-1800 m/z) was followed by 7 MS2 scans of the most abundant ions. The MS2 spectra data were extracted from the raw file using RAW Xtractor (version 1.9.1; publicly available at http://fields.scripps.edu/downloads.php). MS2 spectra data were searched using the Sequest algorithm against the latest version of the mouse IPI database concatenated with the reversed database for assessment of false-discovery rates. Sequest searches allowed for static modification of cysteine residues (+57.02146, alkylation), variable methionine oxidation (+15.9949), mass shifts of labeled amino acids (+10.0083 R, +8.0142 K) and no enzyme specificity. The resulting MS2 spectra matches were assembled into protein identifications and filtered using DTASelect (version 2.0) using the --modstat, --mass, and --trypstat options (applies different statistical models for the analysis of methionine oxidation, high resolution masses, and peptide digestion state, respectively). Ratios of light/heavy peaks were calculated using in-house software and normalized at the peptide level to the average ratio of all non-serine hydrolase peptides. Reported ratios represent the mean of all unique, quantified peptides per protein and do not include peptides that were >3 standard deviations from the median peptide value. Proteins with fewer than three peptides per protein ID were not included in the analysis. Assay Cutoff: A compound was considered active for a particular target/anti-target with a light/heavy ratio of ≤0.5.
Selectivity analysis by ABPP-SILAC in situ (AID 651980)
Assay Overview: The purpose of this assay is to determine the selectivity profile of powder samples of test compounds using stable isotope labeling with amino acids in cell culture (SILAC) ABPP. In this assay, cultured HEK293T cells are metabolically labeled with light or heavy amino acids. Light and heavy cells are treated with inhibitor and DMSO, respectively,in situ, followed by the cell-permeable alkyne-functionalized triazole urea ABPP probe NHU5 [12]. NHU5 covalently reacts with a subset of serine hydrolases, including LYPLA2 and LYPLA1, and shows slower reaction kinetics than other cell-permeable serine hydrolase-specific ABPP probes (e.g., FP-alkyne), facilitating analysis of target inhibition by reversible compounds. Cells are harvested, proteome fractions isolated and reacted with a biotin-functionalized azide tag under copper(I)-catalyzed azide-alkyne cycloaddition (“click chemistry”) reaction conditions for enrichment of probe-tagged proteins. Light and heavy samples are combined in a 1:1 (w/w) ratio. Biotinylated proteins are enriched, trypsinized, and analyzed by LC/LC-MS/MS (MudPIT). Inhibition of target and anti-target activity is quantified by comparing intensities of light and heavy peptide peaks. As designed, compounds that act as inhibitors will block NHU5 probe labeling, reducing enrichment in the inhibitor-treated (light) sample relative to the DMSO-treated (heavy) sample, giving a smaller light/heavy ratio for each protein. Proteins not targeted by inhibitors would be expected to have a ratio close to 1.
Sample Preparation. HEK293T cells were initially grown for 6 passages in either light or heavy SILAC DMEM medium supplemented with 10% dialyzed FCS and 1x PenStrep Glutamine in a humidified incubator (37 °C, 5% CO2). Light medium was supplemented with 100 µg/mL L-arginine (Sigma) and 100 µg/mL L-lysine (Sigma). Heavy medium was supplemented with 100 µg/mL [13C615N4]-L-Arginine (Isotek) and 100 µg/mL [13C615N2]-L-Lysine (Isotek). Light cells were treated with test compound (5 µM) and heavy cells were treated with DMSO for 3 hours at 37 °C. Activity-based alkyne probe NHU5 (50 µM) was added, and cells incubated for 1 hour at 37 °C. After 1 hour, cells were washed (4x DPBS), harvested, isolated by centrifugation at 1,400 x g for 3 minutes, re-suspended in methanol/chloroform/dH2O (4:1:3 v/v), and vortexed. After centrifugation at 13,000 x g for 3 minutes, the upper layer was removed and 3 volumes of methanol were added and the solution vortexed. Protein was pelleted by centrifugation at 13,000 x g for 6 minutes. The supernatant was removed and the pellet was air-dried and re-suspended in PBS by sonication. Light and heavy proteomes were mixed in 1:1 (w/w) ratio to generate one membrane and one soluble sample. For affinity purification of probe-labeled proteins, click chemistry with a biotin-azide tag (100 µM) was carried out under standard conditions (1 mM TCEP, 100 µM TBTA ligand, 1 mM Cu(II)sulfate, 1 hour, 25 °C), and excess reagents removed by washing the precipitated protein with cold methanol (3 × 750 µL). The protein pellets were resolubilized in 2.5% SDS/DPBS (750 µL) by sonication and heating (60 degrees C, 5 minutes). The concentration of SDS was reduced to 0.5% with DPBS (3 mL), and biotinylated proteins enriched with streptavidin beads (50 µL, 1 hour, 25 °C). The beads were washed with 1% SDS in DPBS (1x), 6 M urea (1x), and DPBS (2x), then resuspended in in 6 M urea (150 µL), reduced with 5 mM TCEP for 20 minutes, and alkylated with 10 mM iodoacetamide for 30 minutes at 25 °C in the dark, and the urea concentration was reduced to 2 M with 2x volume DPBS. On-bead digestions were performed for 12 hours at 37 °C with sequence-grade modified trypsin (Promega; 2 µg) in the presence of 2 mM CaCl2. Peptide samples were acidified to a final concentration of 5% (v/v) formic acid and stored at -80 °C prior to analysis.
LC-MS/MS analysis. Samples were analyzed by multidimensional liquid chromatography tandem mass spectrometry (MudPIT) using an Agilent 1100-series quaternary pump and Thermo Scientific LTQ Orbitrap ion trap mass spectrometer. Peptides were eluted in a 5-step MudPIT experiment using 0%, 25%, 50%, 80%, and 100% salt bumps of 500 mM aqueous ammonium acetate and data were collected in data-dependent acquisition mode with dynamic exclusion turned on (60 s, repeat of 1). Specifically, one full MS (MS1) scan (400-1800 m/z) was followed by 7 MS2 scans of the most abundant ions. The MS2 spectra data were extracted from the raw file using RAW Xtractor (version 1.9.1; publicly available at http://fields.scripps.edu/downloads.php). MS2 spectra data were searched using the Sequest algorithm against the latest version of the mouse IPI database concatenated with the reversed database for assessment of false-discovery rates. Sequest searches allowed for static modification of cysteine residues (+57.02146 due to alkylation), variable methionine oxidation (+15.9949), mass shifts of labeled amino acids (+10.0083 R, +8.0142 K) and no enzyme specificity. The resulting MS2 spectra matches were assembled into protein identifications and filtered using DTASelect (version 2.0) using the --modstat, --mass, and --trypstat options (applies different statistical models for the analysis of methionine oxidation state, high resolution masses, and peptide digestion state, respectively). Ratios of light/heavy peaks were calculated using in-house software and normalized at the peptide level to the average ratio of all non-serine hydrolase peptides. Reported ratios represent the mean of all unique, quantified peptides per protein and do not include peptides that were >3 standard deviations from the median peptide value. Proteins with fewer than three peptides per protein ID were not included in the analysis. Assay Cutoff A compound was considered active for a particular target/anti-target with a light/heavy ratio of ≤0.5.
2.2. Probe Chemical Characterization

The probe structure was verified by 1H and 13C NMR (see Section 2.3) and high resolution MS (m/z calculated for C23H22N2O4S2 [M+H]+: 455.1094; found, 455.1095. Purity was assessed to be greater than 95% by NMR. Solubility (room temperature) was determined to be <1 µM in PBS, 0.5 µM in DMEM, and 8.6 µM in DMEM containing 10% fetal calf serum. The latter buffer conditions are more relevant to biological experiments (complex proteome, cell-based studies in serum-containing medium, in vivo), and we have not found the solubility to be a hindrance for biological application (Sections 3.5 and 3.6 and ref. [12]). However, gel-based ABPP anti-target selectivity data collected at 10 µM compound concentration (Sections 3.4 and 3.6) should be treated with some caution given the lower solubility limits; however, all cell-based potency (Section 3.5) and SILAC-ABPP selectivity studies (Section 3.6) were conducted with compound concentrations below solubility limits. Stability in PBS was determined to be >48 hours.
Table 2.2-1Compounds submitted to the SMR collection
| Designation | CID | SID | SRID | MLS |
|---|---|---|---|---|
| Probe | 16193817 | 160654496 | SR-01000775306-4 | MLS004819995 |
| Analog 1 | 70697699 | 160709337 | SR-02000002491-1 | MLS004819996 |
| Analog 2 | 70697697 | 160709338 | SR-02000002492-1 | MLS004819997 |
| Analog 3 | 70697706 | 160709343 | SR-02000002497-1 | MLS004819998 |
| Analog 4 | 70697709 | 160709344 | SR-02000002498-1 | MLS004819999 |
| Analog 5 | 70697700 | 160709345 | SR-02000002499-1 | MLS004820000 |
| Analog 6 | 11957183 | 161004944 | SR-01000687879-3 | MLS004820344 |
| Analog 7 | 1316101 | 161004948 | SR-01000679418-4 | MLS004820345 |
| Analog 8 | 23602465 | 161004943 | SR-02000002342-2 | MLS004820346 |
| Analog 9 | 23602694 | 161004942 | SR-02000002345-2 | MLS004820347 |
2.3. Probe Preparation

(5,5-Dioxido-4H-thieno[3,2-c]thiochromen-2-yl)(4-(4-methoxyphenyl)piperazin-1-yl)methanone (ML349)
To a solution of 4H-thieno[3,2-c]thiochromene-2-carboxylic acid 5,5-dioxide (A, 25 mg, 0.089 mmol) in dichloromethane (1.0 mL) were added 1-(4-methoxyphenyl)piperazine (B, 17 mg, 0.089 mmol), EDC (51 mg, 0.267 mmol) and 4-DMAP (catalyst) at room temperature. After stirring for 12 hours at room temperature, the reaction was quenched with 3.0 mL of saturated aqueous NaHCO3 solution. The organic layer was separated and the aqueous layer was extracted with dichloromethane. The combined organic extracts were washed with brine, dried over MgSO4, filtered and concentrated. The crude product was purified by flash column chromatography using a 97:3 v/v dichloromethane:methanol as solvent to afford the desired compound (35 mg, 87 % yield) as a yellow solid. 1H NMR 400 MHz (CDCl3): δ 8.05 - 8.03 (d, J = 7.6 Hz, 1H), 7.68 - 7.61 (m, 2H), 7.56 - 7.52 (t, J = 7.6 Hz, 1H), 7.21 (s, 1H), 6.93 - 6.91 (m, 2H), 6.87- 6.85 (m, 2H), 4.44 (s, 2H), 3.93 (m, 4H), 3.78 (s, 3H), 3.13 (m, 4H); purity > 95%. 13C NMR 133 MHz (CDCl3): δ 162.5, 154.9, 145.4, 137.7, 136.6, 134.3, 133.9, 130.4, 130.2, 129.6, 128.2, 126.2, 124.6, 119.4, 114.9, 77.6, 77.1, 55.9, 51.6. HRMS (m/z): [M+H]+ calculated for C23H22N2O4S2: 455.1094; found, 455.1095.
3. Results
As determined by gel-based ABPP, probe ML349 has an IC50 value of 144 nM in vitro against LYPLA2 (Sections 3.2). Out of more than 20 SHs (including lipases, esterases, proteases, and uncharacterized hydrolases) profiled by gel-based ABPP, ML349 is observed to have no off-targets (up to 10 µM, Sections 3.4 and 3.6), including close homolog LYPLA1 (up to 3 µM, Sections 3.2), affording a good selectivity window for target inhibition. ML349 does not exhibit overt cytotoxicity, has sufficient solubility in serum-containing medium (8.6 µM) for biological characterization (Sections 3.5 and 3.6), shows good chemical stability (>48 hours), and no overt chemical reactivity (Sections 2.2). Importantly, ML349 target engagement has been demonstrated both in situ and in vivo (Section 3.5). Selectivity for the probe was also confirmed by in-depth LC-MS/MS profiling of 30+ other SHs in vitro and in situ by ABPP-SILAC as detailed in Section 3.6.
3.1. Summary of Screening Results
In the primary fluopol-ABPP HTS [17] assay for LYPLA2 (AID 2177), ∼315K compounds were screened with the SH-specific FP-Rh probe [15]. A total of 1197 compounds (0.38%) were active, passing the set threshold of 25.78% LYPLA2 inhibition. For the confirmation HTS screen (AID 2232), 1098 active compounds were retested in triplicate, and 790 compounds (72%) were confirmed as active (Figure 3.1-1).
Figure 3.1-1
Flow chart describing HTS results.
Prior to secondary screening, the active compounds were filtered to remove compounds with at least 30% activity against previous fluopol-ABPP enzyme inhibitor screens: GSTO1 (AID 1974; 36 compounds), PME-1 (AID 2130, 8 compounds), and LYPLA1 (AID 2174; 50 compounds). Additionally, 14 compounds with greater than 5% hit rate in all bioassays tested were removed. Of the remaining compounds, all available hits with at least 50% inhibition against LYPLA2 (154 compounds) were subject to gel-based ABPP secondary screening. (Note: dual LYPLA1/LYPLA2 hit compounds not tested here were assayed as described in the Probe Report for ML211).
The 154 compounds were assayed for their ability to inhibit recombinant human (rh) LYPLA2 by gel-based competitive ABPP [12, 16] in the context of a complex proteome (AID 652029; Supplemental Figures S1 and S2 and Table S1). ABPP is a highly established platform for enzyme activity profiling and inhibitor development, and the methodology is in ubiquitous use by the biological community (e.g., see reviews [18-21]). By nature, activity-based probes (e.g., the SH-specific fluorophosphonate [FP] probes) are active-site directed, reporting directly on the activity state of the enzyme. As such they give the same type of readout as a substrate-based assay (as previously demonstrated for other SHs, e.g., FAAH [16], KIAA1363 [22], and MAGL [23]), providing crucial details regarding probe concentration and treatment time needed to inactive the enzyme target. Moreover, ABPP assays are readily applied for assessing enzyme activity both in situ (live cells) and in vivo (animal models), Sections 3.5 and 3.6 [12].
In this gel-based assay, a complex mouse brain proteome (chosen for its number and diversity of gel-resolvable SHs for optimal selectivity profiling) containing endogenous and spiked-in recombinant forms of LYPLA2, is incubated with test compound (20 µM) followed by reaction with the fluorescently-tagged activity-based probe fluorophosphonate-rhodamine (FP-Rh). The reaction products are separated by SDS-PAGE and visualized in-gel using a flatbed fluorescence scanner. Test compounds that act as LYPLA2 inhibitors will prevent enzyme-probe interactions, thereby decreasing the fluorescence intensity of the protein bands. Of the 154 compounds tested, 39 exhibited at least 50% inhibition of LYPLA2 (AID 652029). The top hits from this assay, as well as 10 compounds that registered as LYPLA2-selective from AID 493105 (secondary gel-based ABPP screening for LYPLA1-selective and dual LYPLA1/LYPLA2 inhibitors) were rescreened against rhLYPLA2 and endogenous mouse (em) LYPLA2 and emLYPLA1 at a lower (10 µM) compound concentration. Seven compounds (Table 3.1-1) showed good inhibition (>30%) for both rhLYPLA2 and emLYPLA2 and reduced activity (<30%) for anti-target emLYPLA1.
Table 3.1-1
Top LYPLA2-selective inhibitors from gel-based 2ary Screen (see supplemental for complete results).
The top lead (CID 16193817, subsequently designated ML349), as well as compounds 166 and 61 possess a piperazine amide core with a 4-methoxyphenyl substituent, which was the initial focus of the SAR campaign as detailed in Sections 3.4.
3.2. Dose Response Curves for Probe
In vitro IC50 values for ML349 against target LYPLA2 (IC50 of 144 nM) and anti-target LYPLA1 (IC50 > 3000 nM) were obtained from gel-based competitive-ABPP data using the FP-PEG-Rh activity-based probe in a complex proteome lysate against the endogenous human enzyme (AID 651990) [12] (Figure 3.2-1). FP-PEG-Rh was utilized for this study as it exhibits slower labeling kinetics than the more widely utilized ABPP probe FP-Rh, facilitating analysis of reversible inhibitors like ML349 (see Section 3.3 and ref. 12).

Figure 3.2-1
IC50 curves for probe ML349 (SID 160654496) for target LYPLA2 and anti-target LYPLA1 as determined by gel-based competitive-ABPP with the activity-based probe FP-PEG-Rh against endogenous human enzyme in a complex proteome (HEK293T soluble proteome). (more...)
In a complementary substrate assay with purified, recombinant human enzyme, an IC50 of 510 nM and Ki of 230 nM were calculated for ML349 inhibition of LYPLA2 (Figure 3.2-2). Given the different experimental conditions (endogenous vs. purified enzyme), some difference in calculated IC50s vs. gel-based ABPP (Figure 3.2-1) is to be expected. Little (<50%) inhibition of anti-target LYPLA1 was observed up to ∼10 µM under the same conditions.

Figure 3.2-2
IC50 curves for probe ML349 (SID 160654496) for target LYPLA2 and anti-target LYPLA1 as determined by fluorogenic resorufin acetate substrate hydrolysis assay with 10 nM purified recombinant human LYPLA2 and LYPLA1; graph shows inhibition of substrate (more...)
3.3. Scaffold/Moiety Chemical Liabilities
ML349 lacked any obvious electrophilic moieties for covalent enzyme modification, suggesting that the probe operated by a reversible mechanism. This hypothesis was confirmed by gel filtration studies, which demonstrated near-complete recovery of ABPP probe (FP-PEG-Rh) labeling for LYPLA2 after two rounds of gel filtration to remove small molecules (e.g., inhibitor compounds) as shown in Figure 3.3-1 (AID 651987) [12]. For comparison, even three rounds of gel filtration did not result in recovery of ABPP probe labeling when LYPLA1 and LYPLA2 were treated with the covalent triazole urea inhibitor AA26-9. Prior LC-MS/MS characterization has determined that compounds of the triazole urea class like AA26-9 inactivate their SH targets by irreversible carbamoylation of the catalytic serine [24]. Likewise, ML349 did not show any reactivity with glutathione (50 µM, 6 hrs).

Figure 3.3-1
Gel Filtration studies reveal that ML349 is a reversible inhibitor (left); treatment with irreversible inhibitor AA26-9 shown for comparison (right). Soluble HEK293T proteome was treated with test compound or DMSO (control) for 30 minutes. Aliquots were (more...)
3.4. SAR Tables
The SAR Tables 3.4-1 and 3.4-2 include 24 purchased and synthetic compounds: the initial top two hits from HTS (ML349 and cpd 7 in Table 3.4-1; note: cpd 7 also listed as cpd 66 in Table 3.1-1 and supplemental), 11 other reversible analogs (Table 3.4-1) and 14 analogs based on a triazole urea scaffold (Table 3.4-2). We previously identified a triazole urea (SID 7974398) as a top lead in the HTS assay for LYPLA1 inhibitors (AID 2174), and have subsequently derived triazole urea probes for LYPLA1/LYPLA2 (ML211), PAFAH2 (ML225), ABHD11 (ML226), DAGLβ (ML294), and ABHD6 (ML295) as shown in Figure 3.4-1. As a class, the triazole ureas were found to have tunable potency and selectivity, low cytotoxicity, and good activity in situ and in vivo (see respective Probe Reports and refs. [24, 25]). As such, we thought it might be possible to graft structural elements of the successful reversible LYPLA2 inhibitors onto the triazole urea core; however, as discussed below, selectivity vs. LYPLA1 was not preserved with this series of analogs.
Table 3.4-1
Piperazine Amide SAR.
Table 3.4-2
Triazole Urea SAR.

Figure 3.4-1
Structures of triazole urea HTS hit and derived SH Probes.
As summarized in the tables below, SAR compounds were subject to gel-based competitive ABPP profiling [12, 16] to assess potency and selectivity against several dozen FP-sensitive SHs in the HEK293T proteome, which endogenously expresses target LYPLA2 and anti-target LYPLA1 (Figure 3.6-1). For this assay, we modified the ABPP conditions previously employed for HTS hit evaluation (Section 3.1 and supplemental) to optimize for assessment of reversible inhibitors by utilizing an FP-PEG-Rh probe, which has slower labeling kinetics than the standard FP-Rh serine-hydrolase specific ABPP probe, minimizing out-competition [12]. Compounds were tested at 300 nM, 1 µM, and 10 µM concentration.

Figure 3.6-1
Potency and selectivity of piperazine amide SAR compounds (Table 3.4-1) at 300 nM (A), 1 µM (B), and 10 µM (C) concentration as assessed by gel-based competitive ABPP with the SH-specific ABPP probe FP-PEG-Rh in the HEK293T soluble proteome. (more...)
As noted in Sections 2.2, the solubility determined for ML349 (8.6 µM) is somewhat below the 10 µM test compound concentration. As such, some of the anti-target data collected at 10 µM should be treated with caution; however, even if anti-target selectivity is calculated using 8.6 µM as an upper limit, selectivity is still more than sufficient for complete inactivation of LYPLA2 without apparent anti-target effects.
To investigate the SAR around the piperazine amide core of ML349, compounds 2-13 were obtained from commercial vendors and evaluated by gel-based competitive ABPP (see Table 3.4-1 for summary and Section 3.6 for gel images). Overall, the SAR profile was rather steep, with only analogs 7, 9, and 10 showing good inhibition at 1 µM test compound concentration. ML349 and these three select analogs are distinguished by 4-substituted phenyl groups at R1 (e.g., vs. 3, 4, and 5), suggesting this structural element is key to activity. However, none of the analogs exhibited potency rivaling that of ML349. In terms of selectivity, none of the compounds in the piperazine amide series showed evidence of significant inhibition of other SH anti-targets by gel-based profiling, even at the highest test concentration (10 µM). As noted above in Sections 2.2, this value is slightly outside the range of solubility for ML349, so these results should be treated with some caution; however, setting an upper limit of 8.6 µM still provides a large (60-fold) selectivity window for inhibition of LYPLA2 (IC50 of 144 nM, Sections 3.2) vs. all other SHs profiled by gel-based ABPP. It is of note that the identified probe ML348 (Figure 1-1, see ML348 Probe Report) for anti-target LYPLA1, which shares high (65%) sequence identity with LYPLA2, also exhibits a piperazine amide core, suggesting that the scaffold is a privileged chemotype for selective inhibition of this subfamily of SHs.

Figure 1-1
Structures of LYPLA2 and LYPLA1 Probes derived from HTS at SRIMSC. See respective Probe Reports for ML211 and ML348 for more details.
As mentioned above, we previously optimized a dual LYPLA1/LYPLA2 inhibitor (ML211, Figure 1.1 and Figure 3.4-1) based on the triazole urea scaffold as identified in an HTS hit compound (Figure 3.4-1). We hoped to combine structural elements of the reversible compound ML349 with the core triazole urea scaffold to derive a selective LYPLA2 inhibitor. As such, we preserved the left hand piperazine amide of ML349 bearing the 4-methoxyphenyl substituent at R1 and replaced the fused cyclic system with a series of 2,4- and 1,4-triazoles (Table 3.4-2). These compounds all had some inhibitory activity for LYPLA2 and LYPLA1; however, none exhibited sufficient LYPLA2 vs. LYPLA1 selectivity to merit further pursuit.
Finally, we resynthesized ML349 as SID 160654496 (Table 3.4-1) as described in Section 2.3 and confirmed structure by 1H-NMR and HRMS as detailed in Sections 2.2. Inhibitory activity for LYPLA2 and selectivity vs. LYPLA1 was confirmed by competitive ABPP (IC50 = 144 nM for LYPLA2, > 3000 nM for LYPLA1, Sections 3.2).
3.5. Cellular Activity
In situ Inhibition: LYPLA2 probe ML349 (SID 160654496) and LYPLA1 Probe ML348 (SID 160654487; see Figure 1-1 or 3.4-1 for structure and ML348 Probe Report for more details) are active in situ against both the human and mouse isoforms of LYPLA enzymes (AID 651986) as assessed by gel-based competitive ABPP following three hours of compound treatment (5 µM) and in situ competition with cell-permeable alkyne ABPP probe NHU5 (see Figure 3.6-4 for structure [25]). NHU5 labels a subset of SHs with slower kinetics than other SH-selective alkyne probes (e.g., FP-alkyne [12]), thus facilitating competitive ABPP under kinetically controlled conditions. NHU5 can be affixed with a rhodamine-azide (Rh-azide) reporter tag following cell lysis using the Cu(I)-catalyzed azide-alkyne cycloaddition ‘click chemistry’ reaction for fluorescent visualization following SDS-PAGE. As shown in Figure 3.5-1, both probes selectively inhibit their respective targets in cultured cells, and direct, in situ competition with a membrane-permeable click ABPP probe allows for direct readout of target engagement [12]. A more in-depth LC-MS/MS-based ABPP-SILAC analysis of in situ selectivity of ML349 is detailed in Section 3.6.

Figure 3.6-4
Selectivity analysis of ML349 (SID 160654496) by in-depth LC-MS/MS ABPP-SILAC profiling of HEK293T cells shows high selectivity for LYPLA2 in situ. Left: Overview of the in situ ABPP-SILAC method. Right: Inhibition profile of ML349 (5 µM, 3 hour (more...)

Figure 3.5-1
In situ inhibition of LYPLA2 and anti-target LYPLA1 by ML349 (SID 160654496) and ML348 (SID 160654487), respectively. HEK293T cells (A) or murine T-cells (B) cultured in medium supplemented with 10% FCS were treated with compound (5 µM) or DMSO (more...)
In vivo Inhibition: We also assessed the in vivo inhibitory activity of probes ML349 (SID 160654496) and ML348 (SID 160654487) as detailed in AID 651985 and ref. [12]). For this experiment, mice were administered test compound (50 mg/kg, i.p.) or vehicle only. In analogous fashion to the in situ competitive ABPP experiment described above, after three hours, mice were then administered NHU5 probe (100 mg/kg, i.p.). After one hour mice were sacrificed and their tissues (brain, heart, kidney, lung, and liver) removed, homogenized, and NHU5-probe labeled proteins conjugated with the Rh-azide reporter tag by click chemistry for fluorescent visualization following SDS-PAGE (Figure 3.5-2). Complete or near-complete inhibition of their respective targets (LYPLA2 for ML349, LYPLA1 for ML348) is observed in heart, kidney, and lung. In contrast, only ∼50% inhibition is observed in the brain, suggesting limited CNS penetration for this compound class. No inhibition is observed in liver, where the compounds are likely rapidly metabolized. Among the 20+ distinct SH bands, no significant anti-target inhibition is observed in any tissue; these clean profiles indicate that both probes are active and selective in vivo, and reveal tissue-restricted target inhibition.

Figure 3.5-2
Both ML349 (SID 160654496) and ML348 (SID 160654487) show potent and selective activity in vivo. Mice were administered test compound (50 mg/kg, i.p., 3 hours) or vehicle only followed by the NHU5 alkyne SH ABPP probe (100 mg/kg, i.p.). After 1 hour, (more...)
Cytotoxicity: The probe ML349 (SID 160654496) and compound 10 (SID 160654509) were evaluated for cytotoxicity (AID 651991) in HEK293T cells cultured in both serum-free and serum-supplemented medium. As shown in Figure 3.5-3, the compounds did not show evidence of cytotoxicity under either condition up to 50 µM test concentration. It should be noted, however, that the solubility of ML349 was determined to be 0.5 µM in DMEM medium alone and 8.6 µM in DMEM medium containing 10% serum. As such, the results of the experiments should be interpreted with caution. However, if 8.6 µM is used as an upper limit on cytotoxicity (in the more biologically-relevant serum-supplemented conditions), that value is still above the in situ dosing for complete target inhibition (5 µM, Figure 3.5-1), giving an adequate window for use in cell-based assays.
Figure 3.5-3
Cytotoxicity anaysis of probe ML349 (SID 160654496) and compound 10 (SID 160654509) in serum-free (left) and serum-supplemented (right) medium. HEK293T cells cultured in DMEM medium with and without 10% FCS were treated with test compound and viability (more...)
3.6. Profiling Assays
HTS Assays: To date, ML349 (CID 16193817) has been tested in 500 other high-throughput cell-based and non-cell based bioassays deposited in PubChem, and has shown activity in only 7 of those assays, giving a hit rate of 1.4%. Among target-specific assays, the compound registered modest, unconfirmed activity at relatively high – 3 to 50 µM – test concentrations for: NPY receptors [AIDs 1304 and 1359], MEK kinase [AID 1531], TAAR1 [AID 624466], and GNA15 [AID 651780]. This low hit rate suggests that this compound is not generally active; however, investigation of these possible inhibitor-target interactions could be the subject of future investigation.
Gel-based Competitive ABPP: This medium-throughput proteome-wide screening technique is an invaluable method for characterizing both reversible and irreversible inhibitors (Sections 3.4), allowing rapid assessment of potency and selectivity among SHs (including lipases, esterases, proteases, and uncharacterized hydrolases), as visualized by disappearance of bands in compound-treated lanes relative to the DMSO-only control. It should be noted that gel-based profiling gives access to fairly low abundant proteins. For example, we have previously determined that we could detect the SH fatty acid amide hydrolase (FAAH) at concentrations as low as 0.0005% of the total proteome (∼200 copies per cell) by gel-based ABPP [15].
Probe ML349 (SID 160654496) and analogs listed in Tables 3.4-1 and 3.4-2 have been subject to gel-based competitive ABPP screening to assess SH reactivity against more than 20 FP-sensitive SHs visible by 1D SDS-PAGE separation and fluorescent detection in the HEK293T proteome (Figures 3.6-1 and 3.6-2, AIDs 651988 and 652018). Compound treatment (300 nM, 1 µM, or 10 µM, 30 minutes) was followed by labeling with FP-PEG-Rh (5 µM, 30 minutes), SDS-PAGE, and in-gel fluorescent visualization of FP-labeled proteins. Assignment of LYPLA1/2 bands was based on correlation of molecular weights, expression and inhibition profiles with LC-MS/MS data [24,26] and recombinant enzyme expression [26]. Proteins are listed as anti-targets (Sections 3.4) if at least 50% inhibition is observed as quantified relative to the DMSO control. Probe solubility may be slightly compromised at the highest (10 µM) concentration, as ML349 would be expected to have solubility in a complex proteome lysate similar to that for FCS-containing medium (8.6 µM). No significant anti-target activity is observed for ML349 at any test concentration, whereas some of the other analogs show potent inhibition of close homolog LYPLA2.

Figure 3.6-2
Potency and selectivity of triazole urea SAR compounds (Table 3.4-2) at 300 nM (A), 1 µM (B), and 10 µM (C) concentration as assessed by gel-based competitive ABPP with the SH-specific ABPP probe FP-PEG-Rh in the HEK293T soluble proteome. (more...)
ABPP-SILAC: To more comprehensively identify potential anti-targets, we utilized an advanced quantitative mass spectrometry (MS)-based platform termed competitive ABPP-SILAC (Figure 3.6-3, left panel). Competitive ABPP-SILAC [12] combines competitive ABPP [16] with stable isotope labeling of cells (SILAC) [27], and allows for precise quantitation of enzyme inhibition by calculating the isotopic ratios of peptides from inhibitor-treated and control cells. We estimate that the sensitivity of a standard LC-MS/MS based ABPP-SILAC assay is at least 10-fold higher than our gel-based assays (0.00005% of the total cell proteome, or 20 copies per cell). As such, this method offers more sensitive detection of low abundance SHs for a comprehensive selectivity analysis.
Figure 3.6-3
Selectivity analysis of ML349 (SID 160654496) by in-depth LC-MS/MS ABPP-SILAC profiling of murine T-cell proteome shows high selectivity for LYPLA2. Left: Overview of the in vitro ABPP-SILAC method. Right: Inhibition profile of ML349 (1 µM, 30 (more...)
In vitro analysis: BW5147-derived murine T-cell hybridoma cells were cultured in ‘light’ medium (with 12C614N2-lysine and 12C614N4-arginine) or ‘heavy’ medium (with 13C615N2-lysine [+8] and 13C615N4-arginine [+10]). After 5-10 passages, near-complete (>97%) enrichment is achieved. Cells were harvested, homogenized, and the soluble and membrane fractions isolated. The light proteomes were treated with 1 µM ML349 (AID 651981) and heavy proteomes were treated with DMSO. After 30 minutes, proteomes were treated with the affinity-tagged SH-specific probe FP-PEG-biotin [12]. Light (ML349-treated) and heavy (DMSO-treated) fractions were then mixed (1:1 w/w light/heavy), enriched with avidin, digested on-bead with trypsin, and analyzed by MudPIT LC-MS/MS [28, 29] using an LTQ-Orbitrap instrument. Light and heavy signals were quantified from parent ion peaks (MS1) and the corresponding proteins identified from product ion profiles (MS2) using the ProLucid search algorithm and filtered using DTASelect (programs available at: http://fields.scripps.edu/researchtools.php). The depicted bar graph represents the average ratios of light/heavy tryptic peptides for each of the SHs identified. Enzymes susceptible to inhibition upon compound treatment would be expected to have light/heavy ratios significantly less than one, while uninhibited enzymes would be expected to have a ratio close to one. The results (Figure 3.6-3, right panel) indicate that ML349 displays high selectivity for mouse LYPLA2 (arrow), blocking >95% of activity in vitro, while not affecting the activity of ∼30 other SHs, including close homolog LYPLA1 (arrow).
In situ analysis: The complementary ABPP-SILAC profiling study was also conducted with cultured cells. HEK293T cells were cultured in ‘light’ or ‘heavy’ medium to near-complete (>97%) enrichment. Light cells were treated with 5 µM ML349 (AID 651980) and heavy cells were treated with DMSO in situ. After three hours, the membrane-permeable activity-based alkyne probe NHU5 (50 µM) was added, and cells incubated for 1 hour. Cells were then harvested, lysed, separated into soluble and membrane fractions, mixed (1:1 w/w light/heavy), and the biotin-azide affinity label appended to NHU5 probe-labeled enzymes using click chemistry. As above, samples were enriched with avidin, digested on-bead with trypsin, and analyzed by MudPIT LC-MS/MS. The results (Figure 3.6-4, right panel) indicate that ML349 also displays high selectivity for human LYPLA2 (arrow) in situ, blocking ∼75% of activity, while not affecting the activity of close to 20 other SHs (note: fewer SHs are labeled by NHU5 than by FP-PEG-biotin), including close homolog LYPLA1 (arrow).
4. Discussion
Probe ML349 was identified as a highly potent and selective reversible inhibitor of the LYPLA2 (IC50 144 nM, Sections 3.2) with high (>20-fold) selectivity for close homolog LYPLA2 (AID 651990). The probe is active in situ and in vivo (Section 3.5), showing potent and selective inhibition of LYPLA2 in several peripheral tissues, some degree of blood-brain barrier penetration, and likely rapid metabolism in the liver. The use of kinetically-tuned ABPP probes (FP-PEG-Rh and NHU5) were instrumental for the direct confirmation of target engagement this reversible (Section 3.3) inhibitor [12]. High selectivity was confirmed for ML349 by gel-based competitive ABPP in vitro (Section 3.6) and in vivo (Section 3.5), as well as by more in-depth LC-MS/MS ABPP-SILAC in vitro and in situ (Section 3.6). The probe is soluble in serum-containing buffer at 8.6 µM, well above its active in situ concentration (5 µM), and exhibits chemical stability as assessed by GSH reactivity assays (Sections 2.2) and its successful application in living systems (Section 3.5). Taken together, these findings suggest that ML349 will be a highly successful probe for biochemical investigation of human and/or mouse LYPLA2.
4.1. Comparison to existing art and how the new probe is an improvement
No selective LYPLA2 inhibitors have been reported in the literature (PubChem and Google searches for [(LYPLA2 OR APT2 OR lysophospholipase 2 OR Acyl protein thioesterase) AND inhibit*]). As such, ML349 represents the first selective chemical tool for investigation of this uncharacterized enzyme.
4.2. Mechanism of Action Studies
ML349 does not possess any obvious electrophilic moieties for covalent modification of LYPLA2. Reversibility of enzyme inhibition was confirmed by gel filtration studies (AID 651987, Section 3.3). Owing to competition with active-site directed activity-based FP and triazole urea probes [12], it can be inferred that ML349 interacts with the active site of LYPLA2.
4.3. Planned Future Studies
We anticipate using ML349 to investigate the endogenous role(s) of LYPLA2 through global proteomic, palmitoylation [1, 11] and metabolomic profiling [30]. In these studies, dual LYPLA1/LYPLA2 inhibitor ML211 and LYPLA1-selective inhibitor ML348 will serve as invaluable controls.
5. References
- 1.
- Martin BR, Cravatt BF. Large-scale profiling of protein palmitoylation in mammalian cells. Nat. Methods. 2009;6(2):135–8. [PMC free article: PMC2775068] [PubMed: 19137006]
- 2.
- Dekker FJ, et al. Small-molecule inhibition of APT1 affects Ras localization and signaling. Nat. Chem. Biol. 2010;6(6):449–56. [PubMed: 20418879]
- 3.
- Smotrys JE, Linder ME. Palmitoylation of intracellular signaling proteins: regulation and function. Annu. Rev. Biochem. 2004;73:559–87. [PubMed: 15189153]
- 4.
- Magee AI, et al. Release of fatty acids from virus glycoproteins by hydroxylamine. Biochim. Biophys. Acta. 1984;798(2):156–66. [PubMed: 6324873]
- 5.
- Rose JK, Adams GA, Gallione CJ. The presence of cysteine in the cytoplasmic domain of the vesicular stomatitis virus glycoprotein is required for palmitate addition. Proc. Natl. Acad. Sci. U. S. A. 1984;81(7):2050–4. [PMC free article: PMC345434] [PubMed: 6326102]
- 6.
- Willumsen BM, et al. Novel determinants of H-Ras plasma membrane localization and transformation. Oncogene. 1996;13(9):1901–9. [PubMed: 8934536]
- 7.
- Duncan JA, Gilman AG. A cytoplasmic acyl-protein thioesterase that removes palmitate from G protein alpha subunits and p21(RAS). J. Biol. Chem. 1998;273(25):15830–7. [PubMed: 9624183]
- 8.
- Sugimoto H, Hayashi H, Yamashita S. Purification, cDNA cloning, and regulation of lysophospholipase from rat liver. J. Biol. Chem. 1996;271(13):7705–11. [PubMed: 8631810]
- 9.
- Hirano T, et al. Thioesterase activity and subcellular localization of acylprotein thioesterase 1/lysophospholipase 1. Biochim. Biophys. Acta. 2009;1791(8):797–805. [PubMed: 19439193]
- 10.
- Toyoda T, Sugimoto H, Yamashita S. Sequence, expression in Escherichia coli, and characterization of lysophospholipase II. Biochim. Biophys. Acta. 1999;1437(2):182–93. [PubMed: 10064901]
- 11.
- Martin BR, et al. Global profiling of dynamic protein palmitoylation. Nat. Methods. 2012;9(1):84–9. [PMC free article: PMC3248616] [PubMed: 22056678]
- 12.
- Adibekian A, et al. Confirming target engagement for reversible inhibitors in vivo by kinetically tuned activity-based probes. J. Am. Chem. Soc. 2012;134(25):10345–8. [PMC free article: PMC3392194] [PubMed: 22690931]
- 13.
- Biel M, et al. Synthesis and evaluation of acyl protein thioesterase 1 (APT1) inhibitors. Chemistry. 2006;12(15):4121–43. [PubMed: 16528788]
- 14.
- Deck P, et al. Development and biological evaluation of acyl protein thioesterase 1 (APT1) inhibitors. Angew. Chem. Int. Ed. Engl. 2005;44(31):4975–80. [PubMed: 16003812]
- 15.
- Jessani N, et al. Enzyme activity profiles of the secreted and membrane proteome that depict cancer cell invasiveness. Proc. Natl. Acad. Sci. U. S. A. 2002;99(16):10335–40. [PMC free article: PMC124915] [PubMed: 12149457]
- 16.
- Leung D, et al. Discovering potent and selective reversible inhibitors of enzymes in complex proteomes. Nat. Biotechnol. 2003;21(6):687–91. [PubMed: 12740587]
- 17.
- Bachovchin DA, et al. Identification of selective inhibitors of uncharacterized enzymes by high-throughput screening with fluorescent activity-based probes. Nat. Biotechnol. 2009;27(4):387–94. [PMC free article: PMC2709489] [PubMed: 19329999]
- 18.
- Heal WP, Dang TH, Tate EW. Activity-based probes: discovering new biology and new drug targets. Chem. Soc. Rev. 2011;40(1):246–57. [PubMed: 20886146]
- 19.
- Lenz T, Fischer JJ, Dreger M. Probing small molecule-protein interactions: A new perspective for functional proteomics. J. Proteomics. 2011;75(1):100–15. [PubMed: 21835278]
- 20.
- Li N, Overkleeft HS, Florea BI. Activity-based protein profiling: an enabling technology in chemical biology research. Curr. Opin. Chem. Biol. 2012;16(1-2):227–33. [PubMed: 22325363]
- 21.
- Nomura DK, Dix MM, Cravatt BF. Activity-based protein profiling for biochemical pathway discovery in cancer. Nat. Rev. Cancer. 2010;10(9):630–8. [PMC free article: PMC3021511] [PubMed: 20703252]
- 22.
- Chiang KP, et al. An enzyme that regulates ether lipid signaling pathways in cancer annotated by multidimensional profiling. Chem. Biol. 2006;13(10):1041–50. [PubMed: 17052608]
- 23.
- Long JZ, et al. Selective blockade of 2-arachidonoylglycerol hydrolysis produces cannabinoid behavioral effects. Nat. Chem. Biol. 2009;5(1):37–44. [PMC free article: PMC2605181] [PubMed: 19029917]
- 24.
- Adibekian A, et al. Click-generated triazole ureas as ultrapotent in vivo-active serine hydrolase inhibitors. Nat. Chem. Biol. 2011;7(7):469–78. [PMC free article: PMC3118922] [PubMed: 21572424]
- 25.
- Hsu KL, et al. DAGLbeta inhibition perturbs a lipid network involved in macrophage inflammatory responses. Nat. Chem. Biol. 2012;8(12):999–1007. [PMC free article: PMC3513945] [PubMed: 23103940]
- 26.
- Bachovchin DA, et al. Superfamily-wide portrait of serine hydrolase inhibition achieved by library-versus-library screening. Proc. Natl. Acad. Sci. U. S. A. 2010;107(49):20941–6. [PMC free article: PMC3000285] [PubMed: 21084632]
- 27.
- Ong SE, et al. Stable isotope labeling by amino acids in cell culture, SILAC, as a simple and accurate approach to expression proteomics. Mol. Cell. Proteomics. 2002;1(5):376–86. [PubMed: 12118079]
- 28.
- Washburn MP, Wolters D, Yates JR 3rd. Large-scale analysis of the yeast proteome by multidimensional protein identification technology. Nat. Biotechnol. 2001;19(3):242–7. [PubMed: 11231557]
- 29.
- Wolters DA, Washburn MP, Yates JR 3rd. An automated multidimensional protein identification technology for shotgun proteomics. Anal. Chem. 2001;73(23):5683–90. [PubMed: 11774908]
- 30.
- Harkewicz R, Dennis EA. Applications of mass spectrometry to lipids and membranes. Annu. Rev. Biochem. 2011;80:301–25. [PMC free article: PMC3410560] [PubMed: 21469951]
6. Supplemental Information for ML349 Probe Report
%20LYPLA2%20and%20endogenous%20mouse%20LYPLA1%20and%20LYPLA2%20in%20the%20mouse%20brain%20soluble%20proteome%20with%2020%20%B5M%20test%20compound%20(30%20minutes)%20and%20the%20SH-specific%20FP-Rh%20ABPP%20probe%20(2%20%B5M%2C%2030%20minutes).&p=BOOKS&id=189927_ml349lf17a.jpg "Click on image to zoom")
%20LYPLA2%20and%20endogenous%20mouse%20LYPLA1%20and%20LYPLA2%20in%20the%20mouse%20brain%20soluble%20proteome%20with%2020%20%B5M%20test%20compound%20(30%20minutes)%20and%20the%20SH-specific%20FP-Rh%20ABPP%20probe%20(2%20%B5M%2C%2030%20minutes).&p=BOOKS&id=189927_ml349lf17b.jpg "Click on image to zoom")
%20LYPLA2%20and%20endogenous%20mouse%20LYPLA1%20and%20LYPLA2%20in%20the%20mouse%20brain%20soluble%20proteome%20with%2020%20%B5M%20test%20compound%20(30%20minutes)%20and%20the%20SH-specific%20FP-Rh%20ABPP%20probe%20(2%20%B5M%2C%2030%20minutes).&p=BOOKS&id=189927_ml349lf17C.jpg "Click on image to zoom")
%20LYPLA2%20and%20endogenous%20mouse%20LYPLA1%20and%20LYPLA2%20in%20the%20mouse%20brain%20soluble%20proteome%20with%2020%20%B5M%20test%20compound%20(30%20minutes)%20and%20the%20SH-specific%20FP-Rh%20ABPP%20probe%20(2%20%B5M%2C%2030%20minutes).&p=BOOKS&id=189927_ml349lf17d.jpg "Click on image to zoom")
Figure S1First Round Secondary Screening: Competitive-ABPP profiling with recombinant human (rh) LYPLA2 and endogenous mouse LYPLA1 and LYPLA2 in the mouse brain soluble proteome with 20 µM test compound (30 minutes) and the SH-specific FP-Rh ABPP probe (2 µM, 30 minutes)
See Table S1 for quantified results and compound SIDs and structures. Fluorescent images shown in grey scale. (AID 652029).
%20LYPLA2%20and%20endogenous%20mouse%20LYPLA1%20and%20LYPLA2%20in%20the%20mouse%20brain%20soluble%20proteome%20with%2010%20%B5M%20test%20compound%20(30%20minutes)%20and%20the%20SH-specific%20FP-Rh%20ABPP%20probe%20(2%20%B5M%2C%2030%20minutes).&p=BOOKS&id=189927_ml349lf18a.jpg "Click on image to zoom")
%20LYPLA2%20and%20endogenous%20mouse%20LYPLA1%20and%20LYPLA2%20in%20the%20mouse%20brain%20soluble%20proteome%20with%2010%20%B5M%20test%20compound%20(30%20minutes)%20and%20the%20SH-specific%20FP-Rh%20ABPP%20probe%20(2%20%B5M%2C%2030%20minutes).&p=BOOKS&id=189927_ml349lf18b.jpg "Click on image to zoom")
Figure S2Second Round Secondary Screening: Competitive-ABPP profiling with recombinant human (rh) LYPLA2 and endogenous mouse LYPLA1 and LYPLA2 in the mouse brain soluble proteome with 10 µM test compound (30 minutes) and the SH-specific FP-Rh ABPP probe (2 µM, 30 minutes)
See Table S1 for quantified results and compound SIDs and structures. Fluorescent images shown in grey scale. (AID 652030).
Table S1Compounds tested by gel-based competitive ABPP Secondary Screening (Figures S1 and S2)
| Cpd # | SRID | SID | CID | Structure | % INH rhLYPLA2 (20 µM) AID 652029; AID 493105 | % INH rhLYPLA2 (10 µM) AID 652030 | % INH emLYPLA2 (10 µM) AID 652030 | % INH emLYPLA1 (10 µM) AID 652030 |
|---|---|---|---|---|---|---|---|---|
| ML349 | SR-01000775306-2 | 92709328 | 16193817 |
 | 100% | 79% | 74% | 25% |
| 4 | SR-01000544381-2 | 49715467 | 24789646 |
 | 61% | 52% | 41% | 33% |
| 5 | SR-01000454606-2 | 49640730 | 1130125 |
 | 34% | 32% | 43% | 34% |
| 10 | SR-01000544853-2 | 24810381 | 16193079 |
 | 50% | 26% | 23% | 0% |
| 19 | SR-01000854272-1 | 57261525 | 16297767 |
 | 32% | 26% | 35% | 40% |
| 22 | SR-01000679356-1 | 17414052 | 2953598 |
 | 41% | 12% | 7% | 0% |
| 27 | SR-01000543175-2 | 24781868 | 16187671 |
 | 39% | 14% | 15% | 0% |
| 55 | SR-01000625310-1 | 7974398 | 735660 |
 | 76% | 47% | 54% | 103% |
| 58 | SR-01000712266-1 | 14728505 | 6917582 |
 | 51% | 47% | 55% | 23% |
| 61 | SR-01000663277-1 | 4245654 | 3240101 |
 | 45% | 47% | 44% | 16% |
| 70 | SR-01000544533-2 | 49730654 | 22334024 |
 | 30% | 18% | 15% | 0% |
| 92 | SR-01000759830-2 | 92709318 | 948192 |
 | 69% | 2% | 0% | 0% |
| 93 | SR-01000457406-3 | 92709254 | 738164 |
 | 67% | 8% | 8% | 0% |
| 94 | SR-01000207125-3 | 92709240 | 2843709 |
 | 70% | 10% | 15% | 0% |
| 95 | SR-01000062699-3 | 92709230 | 4880770 |
 | 49% | NT | NT | NT |
| 96 | SR-01000819662-2 | 92709358 | 7628255 |
 | 70% | 7% | 8% | 5% |
| 97 | SR-01000815302-2 | 92709357 | 707079 |
 | 44% | NT | NT | NT |
| 98 | SR-01000814041-2 | 92709355 | 707134 |
 | 49% | NT | NT | NT |
| 99 | SR-01000859016-2 | 92709376 | 8294576 |
 | 32% | NT | NT | NT |
| 100 | SR-01000643300-3 | 92709274 | 2741630 |
 | 27% | NT | NT | NT |
| 101 | SR-01000811885-2 | 92709354 | 1810599 |
 | 63% | 8% | 8% | 7% |
| 102 | SR-01000814976-2 | 92709356 | 753324 |
 | 34% | NT | NT | NT |
| 103 | SR-01000767921-2 | 92709324 | 6409921 |
 | 43% | NT | NT | NT |
| 104 | SR-01000081889-3 | 92709236 | 22330954 |
 | 36% | NT | NT | NT |
| 105 | SR-01000201553-3 | 92709239 | 2837966 |
 | 70% | 0% | 0% | 0% |
| 106 | SR-01000773342-2 | 92709326 | 3658974 |
 | 20% | NT | NT | NT |
| 107 | SR-01000773509-2 | 92709327 | 286874 |
 | 47% | NT | NT | NT |
| 108 | SR-01000100094-3 | 92709237 | 16193979 |
 | 21% | NT | NT | NT |
| 109 | SR-01000803679-2 | 92709348 | 3565378 |
 | 44% | NT | NT | NT |
| 110 | SR-01000678819-2 | 92709284 | 2768219 |
 | 88% | 14% | 14% | 14% |
| 111 | SR-01000805308-2 | 92709350 | 7003666 |
 | 35% | NT | NT | NT |
| 112 | SR-01000714245-2 | 92709299 | 12005305 |
 | 28% | NT | NT | NT |
| 113 | SR-01000797319-2 | 92709341 | 24791323 |
 | 48% | NT | NT | NT |
| 114 | SR-01000807919-2 | 92709352 | 24792060 |
 | 70% | 10% | 19% | 18% |
| 116 | SR-01000443086-3 | 92709252 | 2872850 |
 | 25% | NT | NT | NT |
| 117 | SR-01000701446-2 | 92709290 | 997434 |
 | 20% | NT | NT | NT |
| 118 | SR-01000666775-2 | 92709277 | 6036769 |
 | 52% | 5% | 13% | 17% |
| 119 | SR-01000732660-2 | 92709306 | 1649169 |
 | 52% | 4% | 12% | 28% |
| 120 | SR-01000802662-2 | 92709347 | 24817537 |
 | 46% | NT | NT | NT |
| 121 | SR-01000834300-2 | 92709370 | 1304219 |
 | 23% | NT | NT | NT |
| 122 | SR-01000331369-3 | 92709250 | 646874 |
 | 9% | NT | NT | NT |
| 123 | SR-01000360756-3 | 92709251 | 3091522 |
 | 45% | NT | NT | NT |
| 124 | SR-01000845983-2 | 92709371 | 6520605 |
 | 80% | 58% | 37% | 28% |
| 125 | SR-01000833730-2 | 92709369 | 2958977 |
 | 35% | NT | NT | NT |
| 126 | SR-01000621197-2 | 92709268 | 3240891 |
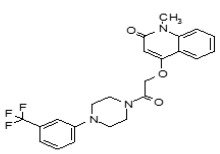 | 15% | NT | NT | NT |
| 127 | SR-01000223822-3 | 92709241 | 5344976 |
 | 36% | NT | NT | NT |
| 128 | SR-01000756517-2 | 92709316 | 16193498 |
 | 33% | NT | NT | NT |
| 129 | SR-01000705143-2 | 92709293 | 5663990 |
 | 19% | NT | NT | NT |
| 130 | SR-01000291611-3 | 92709247 | 1245607 |
 | 28% | NT | NT | NT |
| 131 | SR-01000735614-2 | 92709308 | 16194493 |
 | 14% | NT | NT | NT |
| 132 | SR-01000749021-2 | 92709311 | 3721644 |
 | 61% | 9% | 21% | 27% |
| 133 | SR-01000742048-2 | 92709310 | 4173716 |
 | 60% | 8% | 16% | 19% |
| 134 | SR-01000793455-2 | 92709339 | 24791651 |
 | 12% | NT | NT | NT |
| 135 | SR-01000446197-3 | 92709253 | 16193281 |
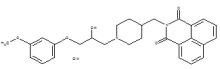 | 12% | NT | NT | NT |
| 136 | SR-01000078450-3 | 92709235 | 3965305 |
 | 1% | NT | NT | NT |
| 137 | SR-01000282109-3 | 92709245 | 9552010 |
 | 20% | NT | NT | NT |
| 138 | SR-01000757786-2 | 92709317 | 1306183 |
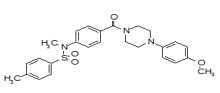 | 3% | NT | NT | NT |
| 141 | SR-01000780012-2 | 92709330 | 16746106 |
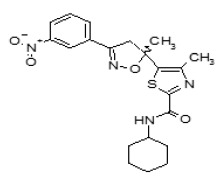 | 45% | NT | NT | NT |
| 142 | SR-01000737809-2 | 92709309 | 15988659 |
 | 37% | NT | NT | NT |
| 143 | SR-01000797748-2 | 92709344 | 984432 |
 | 34% | NT | NT | NT |
| 144 | SR-01000754130-2 | 92709315 | 1297453 |
 | 55% | 7% | 11% | 25% |
| 145 | SR-01000780744-2 | 92709331 | 16746244 |
 | 37% | NT | NT | NT |
| 146 | SR-01000601378-2 | 92709261 | 3236433 |
 | 45% | NT | NT | NT |
| 147 | SR-01000275474-3 | 92709244 | 1295275 |
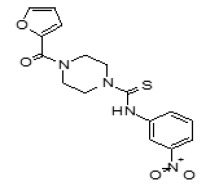 | 36% | NT | NT | NT |
| 148 | SR-01000293957-3 | 92709248 | 4922434 |
 | 17% | NT | NT | NT |
| 149 | SR-01000676688-2 | 92709282 | 1254489 |
 | 24% | NT | NT | NT |
| 150 | SR-01000702900-2 | 92709291 | 2252839 |
 | 60% | 51% | 40% | 9% |
| 151 | SR-01000729542-2 | 92709305 | 978403 |
 | 24% | NT | NT | NT |
| 152 | SR-01000753813-2 | 92709314 | 16190237 |
 | 31% | NT | NT | NT |
| 153 | SR-01000469930-3 | 92709255 | 613159 |
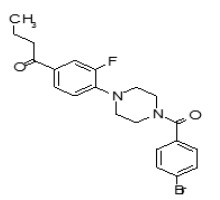 | 8% | NT | NT | NT |
| 154 | SR-01000752432-2 | 92709313 | 2974294 |
 | 36% | NT | NT | NT |
| 155 | SR-01000284867-3 | 92709246 | 1254617 |
 | 38% | NT | NT | NT |
| 156 | SR-01000589819-3 | 92709260 | 3245476 |
 | 49% | NT | NT | NT |
| 157 | SR-01000733170-2 | 92709307 | 3071136 |
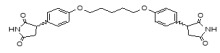 | 32% | NT | NT | NT |
| 158 | SR-01000066572-3 | 92709232 | 2570042 |
 | 12% | NT | NT | NT |
| 159 | SR-01000665583-2 | 92709276 | 1478850 |
 | 8% | NT | NT | NT |
| 160 | SR-01000786127-2 | 92709334 | 20910602 |
 | 75% | 32% | 26% | 3% |
| 161 | SR-01000828709-2 | 92709366 | 1026077 |
 | 26% | NT | NT | NT |
| 162 | SR-01000683355-2 | 92709287 | 3462007 |
 | 28% | NT | NT | NT |
| 163 | SR-01000673732-2 | 92709281 | 3902161 |
 | 37% | NT | NT | NT |
| 164 | SR-01000824627-2 | 92709362 | 24792930 |
 | 31% | NT | NT | NT |
| 165 | SR-01000830441-2 | 92709367 | 20889981 |
 | 46% | NT | NT | NT |
| 166 | SR-01000679418-2 | 92709285 | 1316101 |
 | 86% | 57% | 47% | 16% |
| 167 | SR-01000662341-2 | 92709275 | 3243472 |
 | 70% | 2% | 14% | 1% |
| 168 | SR-01000848981-2 | 92709373 | 24981750 |
 | 38% | NT | NT | NT |
| 169 | SR-01000766596-2 | 92709323 | 2741788 |
 | 19% | NT | NT | NT |
| 170 | SR-01000801514-2 | 92709346 | 3788602 |
 | 46% | NT | NT | NT |
| 171 | SR-01000831430-2 | 92709368 | 1840362 |
 | 47% | NT | NT | NT |
| 172 | SR-01000001214-2 | 92709228 | 662891 |
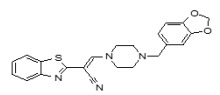 | 40% | NT | NT | NT |
| 173 | SR-01000723100-2 | 92709303 | 11839276 |
 | 94% | 66% | 77% | 17% |
| 174 | SR-01000709307-2 | 92709296 | 2898999 |
 | 13% | NT | NT | NT |
| 175 | SR-01000715741-2 | 92709300 | 6172362 |
 | 15% | NT | NT | NT |
| 176 | SR-01000810886-2 | 92709353 | 23724070 |
 | 49% | NT | NT | NT |
| 177 | SR-01000750069-2 | 92709312 | 4878098 |
 | 45% | NT | NT | NT |
| 178 | SR-01000793481-2 | 92709340 | 22512977 |
 | 44% | NT | NT | NT |
| 179 | SR-01000847861-2 | 92709372 | 18582853 |
 | 20% | NT | NT | NT |
| 180 | SR-01000766413-2 | 92709322 | 2741775 |
 | 72% | 8% | 1% | 0% |
| 181 | SR-01000797397-2 | 92709342 | 3680379 |
 | 40% | NT | NT | NT |
| 182 | SR-01000065907-3 | 92709231 | 2999829 |
 | 29% | NT | NT | NT |
| 183 | SR-01000546965-3 | 92709258 | 22421608 |
 | 43% | NT | NT | NT |
| 184 | SR-01000560006-3 | 92709259 | 3239043 |
 | 13% | NT | NT | NT |
| 185 | SR-01000721481-2 | 92709301 | 9548123 |
 | 63% | 20% | 31% | 13% |
| 186 | SR-01000784484-2 | 92709333 | 1086023 |
 | 38% | NT | NT | NT |
| 187 | SR-01000825443-2 | 92709364 | 20962749 |
 | 49% | NT | NT | NT |
| 188 | SR-01000608049-2 | 92709263 | 5309969 |
 | 35% | NT | NT | NT |
| 189 | SR-01000000093-9 | 92709227 | 5213 |
 | 75% | 14% | 19% | 10% |
| 190 | SR-01000686648-2 | 92709288 | 1280564 |
 | 53% | 9% | 6% | 14% |
| 191 | SR-01000760123-2 | 92709319 | 24747539 |
 | 16% | NT | NT | NT |
| 192 | SR-01000633085-3 | 92709273 | 2810354 |
 | 50% | 8% | 0% | 7% |
| 193 | SR-01000850947-2 | 92709374 | 16573489 |
 | 25% | NT | NT | NT |
| 194 | SR-01000805263-2 | 92709349 | 7003681 |
 | 38% | NT | NT | NT |
| 195 | SR-01000793099-2 | 92709337 | 24789921 |
 | 25% | NT | NT | NT |
| 196 | SR-01000800701-2 | 92709345 | 1365399 |
 | 59% | 7% | 4% | 6% |
| 197 | SR-01000630272-3 | 92709272 | 5742525 |
 | 29% | NT | NT | NT |
| 198 | SR-01000726885-2 | 92709304 | 16195068 |
 | 47% | NT | NT | NT |
| 199 | SR-01000791287-2 | 92709336 | 16297726 |
 | 47% | NT | NT | NT |
| 200 | SR-01000667532-2 | 92709279 | 1377323 |
 | 56% | 2% | 0% | 0% |
| 201 | SR-01000691545-2 | 92709289 | 11839291 |
 | 64% | 4% | 13% | 0% |
| 202 | SR-01000707739-2 | 92709295 | 685764 |
 | 6% | NT | NT | NT |
| 203 | SR-01000858430-2 | 92709375 | 9204120 |
 | 39% | NT | NT | NT |
| 204 | SR-01000667215-2 | 92709278 | 5793288 |
 | 37% | NT | NT | NT |
| 205 | SR-01000544545-3 | 92709257 | 22334032 |
 | 41% | NT | NT | NT |
| 206 | SR-01000615990-2 | 92709267 | 3236420 |
 | 28% | NT | NT | NT |
| 207 | SR-01000712160-2 | 92709297 | 6917421 |
 | 45% | NT | NT | NT |
| 208 | SR-01000066688-3 | 92709233 | 2571709 |
 | 57% | 2% | 0% | 13% |
| 209 | SR-01000824673-2 | 92709363 | 24791406 |
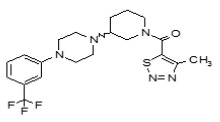 | 28% | NT | NT | NT |
| 210 | SR-01000771036-2 | 92709325 | 4412828 |
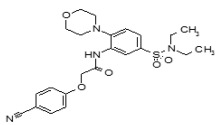 | 64% | 3% | 0% | 12% |
| 211 | SR-01000122489-3 | 92709238 | 3236902 |
 | 64% | 3% | 0% | 15% |
| 212 | SR-01000497226-3 | 92709256 | 2926808 |
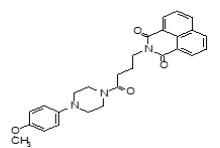 | 32% | NT | NT | NT |
| 213 | SR-01000807695-2 | 92709351 | 24792905 |
 | 64% | 8% | 10% | 18% |
| 214 | SR-01000713834-2 | 92709298 | 3292126 |
 | 44% | NT | NT | NT |
| 215 | SR-01000294241-3 | 92709249 | 2973383 |
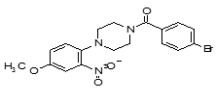 | 20% | NT | NT | NT |
| 216 | SR-01000821601-2 | 92709360 | 15995172 |
 | 10% | NT | NT | NT |
| 217 | SR-01000705213-2 | 92709294 | 4526046 |
 | 23% | NT | NT | NT |
| 218 | SR-01000628221-3 | 92709271 | 2162197 |
 | 50% | 5% | 0% | 18% |
| 219 | SR-01000076890-3 | 92709234 | 24789599 |
 | 58% | 9% | 5% | 16% |
| 220 | SR-01000705033-2 | 92709292 | 6621246 |
 | 56% | 4% | 0% | 14% |
| 221 | SR-01000863954-2 | 92709380 | 44142715 |
 | 45% | NT | NT | NT |
| 222 | SR-01000864098-2 | 92709381 | 44142749 |
 | 46% | NT | NT | NT |
| 223 | SR-01000864120-2 | 92709382 | 44142729 |
 | 45% | NT | NT | NT |
| 224 | SR-01000680078-2 | 92709286 | 2768222 |
 | 29% | NT | NT | NT |
| 225 | SR-01000825835-2 | 92709365 | 3597028 |
 | 61% | 9% | 3% | 14% |
| 226 | SR-01000764111-2 | 92709321 | 24747532 |
 | 35% | NT | NT | NT |
| 227 | SR-01000797649-2 | 92709343 | 24818875 |
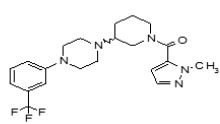 | 37% | NT | NT | NT |
| 228 | SR-01000608632-2 | 92709264 | 5307683 |
 | 23% | NT | NT | NT |
| 229 | SR-01000790625-2 | 92709335 | 15987958 |
 | 16% | NT | NT | NT |
| 230 | SR-01000609441-2 | 92709265 | 1316078 |
 | 34% | NT | NT | NT |
| 231 | SR-01000667859-2 | 92709280 | 3232214 |
 | 59% | 9% | 9% | 3% |
| 232 | SR-01000824457-2 | 92709361 | 24791460 |
 | 43% | NT | NT | NT |
| 233 | SR-01000761248-2 | 92709320 | 16239899 |
 | 16% | NT | NT | NT |
| 234 | SR-01000625354-2 | 92709269 | 1067937 |
 | 17% | NT | NT | NT |
| 235 | SR-01000783468-2 | 92709332 | 6953764 |
 | 14% | NT | NT | NT |
| 236 | SR-01000272989-3 | 92709243 | 5923405 |
 | 0% | NT | NT | NT |
| 237 | SR-01000601381-2 | 92709262 | 3237838 |
 | 50% | 8% | 0% | 6% |
| 238 | SR-01000863494-2 | 92709377 | 44142737 |
 | 13% | NT | NT | NT |
| 239 | SR-01000863646-2 | 92709378 | 44142744 |
 | 34% | NT | NT | NT |
| 240 | SR-01000820483-2 | 92709359 | 1078732 |
 | 20% | NT | NT | NT |
| 241 | SR-01000863713-2 | 92709379 | 44142722 |
 | 41% | NT | NT | NT |
| 242 | SR-01000793441-2 | 92709338 | 20854208 |
 | 38% | NT | NT | NT |
| 243 | SR-01000626623-2 | 92709270 | 115423 |
 | 18% | NT | NT | NT |
| 244 | SR-01000237880-3 | 92709242 | 1343676 |
 | 50% | 16% | 24% | 15% |
| 245 | SR-01000721971-2 | 92709302 | 15945738 |
 | 20% | NT | NT | NT |
| 246 | SR-01000775340-2 | 92709329 | 1966809 |
 | 37% | NT | NT | NT |
| 247 | SR-01000677508-2 | 92709283 | 1914729 |
 | 18% | NT | NT | NT |
Green highlight: active
NT: not tested
Table S2Enzyme Names and Identifiers for ABPP-SILAC experiments
| Abbreviation | Name | GeneID | Protein GI | Organism |
|---|---|---|---|---|
| Aadacl1 (Kiaa1363; Nceh1) | neutral cholesterol ester hydrolase 1 | 320024 | 30520239 | Mus musculus |
| 57552 | 68051721 | Homo sapiens | ||
| Abhd10 | abhydrolase domain containing protein 10 | 55347 | 8923001 | Homo sapiens |
| Abhd12 | abhydrolase domain containing protein 12 | 76192 | 159110817 | Mus musculus |
| 26090 | 109689718 | Homo sapiens | ||
| Abhd6 | abhydrolase domain containing protein 6 | 66082 | 31560264 | Mus musculus |
| 57406 | 189027141 | Homo sapiens | ||
| Acot1 | acyl-coenzyme A thioesterase 1 | 26897 | 6753550 | Mus musculus |
| Acot2 | acyl-coenzyme A thioesterase 2 | 171210 | 238624114 | Mus musculus |
| Apeh | acylpeptide hydrolase | 235606 | 19343726 | Mus musculus |
| 327 | 23510451 | Homo sapiens | ||
| Ctsa | lysosomal protective protein | 5476 | 119395729 | Homo sapiens |
| Dpp4 | dipeptidyl peptidase 4 | 13482 | 6753674 | Mus musculus |
| Dpp8 | dipeptidyl peptidase 8 | 74388 | 31542571 | Mus musculus |
| Dpp9 | dipeptidyl peptidase 9 | 224897 | 255003757 | Mus musculus |
| 91039 | 67460390 | Homo sapiens | ||
| Esd | esterase D/formylglutathione hydrolase | 13885 | 13937355 | Mus musculus |
| 2098 | 33413400 | Homo sapiens | ||
| Faah | fatty acid amide hydrolase | 14073 | 123253900 | Mus musculus |
| Fasn | fatty acid synthase | 14104 | 93102409 | Mus musculus |
| 2194 | 41872631 | Homo sapiens | ||
| Lipe | hormone-sensitive lipase | 16890 | 87239972 | Mus musculus |
| Lypla1 | lysophospholipase 1 | 18777 | 6678760 | Mus musculus |
| 10434 | 5453722 | Homo sapiens | ||
| Lypla2 | lysophospholipase 2 | 26394 | 7242156 | Mus musculus |
| 11313 | 9966764 | Homo sapiens | ||
| Lyplal1 | lysophospholipase-like 1 | 127018 | 20270341 | Homo sapiens |
| Mgll (Magl) | monoacylclycerol lipase | 11343 | 6005786 | Homo sapiens |
| Pafah1b2 | platelet-activating factor acetylhydrolase IB subunit beta | 18475 | 40254624 | Mus musculus |
| Pafah1b3 | platelet-activating factor acetylhydrolase IB subunit gamma | 18476 | 6679201 | Mus musculus |
| Pafah2 | platelet-activating factor acetylhydrolase 2 | 100163 | 225579137 | Mus musculus |
| Pla2g4a | cytosolic phospholipase A2 | 5321 | 23943920 | Homo sapiens |
| Pnpla6 | patatin-like phospholipase domain containing protein 6 | 50767 | 170763472 | Mus musculus |
| 10908 | 260656037 | Homo sapiens | ||
| Pnpla7 | patatin-like phospholipase domain containing protein 7 | 241274 | 225007615 | Mus musculus |
| Ppme1 (Pme1) | protein phosphatase methylesterase 1 | 72590 | 30794138 | Mus musculus |
| 51400 | 7706645 | Homo sapiens | ||
| Prcp | proline carboxypeptidase | 72461 | 33469015 | Mus musculus |
| Prep | prolyl endopeptidase | 19072 | 6755152 | Mus musculus |
| 5550 | 41349456 | Homo sapiens | ||
| Sec23ip | Sec23ip protein | 207352 | 133777972 | Mus musculus |
| Tpp2 | tripeptidyl peptidase 2 | 22019 | 37194903 | Mus musculus |
| 7174 | 119629464 | Homo sapiens |
- PMCPubMed Central citations
- PubChem BioAssay for Chemical ProbePubChem BioAssay records reporting screening data for the development of the chemical probe(s) described in this book chapter
- PubChem SubstanceRelated PubChem Substances
- PubMedLinks to PubMed
- Review Characterization of a Selective, Reversible Inhibitor of Lysophospholipase 1 (LYPLA1).[Probe Reports from the NIH Mol...]Review Characterization of a Selective, Reversible Inhibitor of Lysophospholipase 1 (LYPLA1).Adibekian A, Martin BR, Chang JW, Hsu KL, Tsuboi K, Bachovchin DA, Speers AE, Brown SJ, Spicer T, Fernandez-Vega V, et al. Probe Reports from the NIH Molecular Libraries Program. 2010
- Review An in Vivo Active Carbamate-based Dual Inhibitor of Lysophospholipase 1 (LYPLA1) and Lysophospholipase 2 (LYPLA2).[Probe Reports from the NIH Mol...]Review An in Vivo Active Carbamate-based Dual Inhibitor of Lysophospholipase 1 (LYPLA1) and Lysophospholipase 2 (LYPLA2).Hulce JJ, Joslyn C, Speers AE, Brown SJ, Spicer T, Fernandez-Vega V, Ferguson J, Cravatt BF, Hodder P, Rosen H. Probe Reports from the NIH Molecular Libraries Program. 2010
- Review Optimization and characterization of a triazole urea dual inhibitor for lysophospholipase 1 (LYPLA1) and lysophospholipase 2 (LYPLA2).[Probe Reports from the NIH Mol...]Review Optimization and characterization of a triazole urea dual inhibitor for lysophospholipase 1 (LYPLA1) and lysophospholipase 2 (LYPLA2).Adibekian A, Martin BR, Speers AE, Brown SJ, Spicer T, Fernandez-Vega V, Ferguson J, Cravatt BF, Hodder P, Rosen H. Probe Reports from the NIH Molecular Libraries Program. 2010
- Review Optimization and characterization of a triazole urea inhibitor for alpha/beta hydrolase domain-containing protein 11 (ABHD11): anti-probe for LYPLA1/LYPLA2 dual inhibitor ML211.[Probe Reports from the NIH Mol...]Review Optimization and characterization of a triazole urea inhibitor for alpha/beta hydrolase domain-containing protein 11 (ABHD11): anti-probe for LYPLA1/LYPLA2 dual inhibitor ML211.Adibekian A, Hsu KL, Speers AE, Brown SJ, Spicer T, Fernandez-Vega V, Ferguson J, Cravatt BF, Hodder P, Rosen H. Probe Reports from the NIH Molecular Libraries Program. 2010
- Review Optimization and characterization of a triazole urea inhibitor for platelet-activating factor acetylhydrolase type 2 (PAFAH2).[Probe Reports from the NIH Mol...]Review Optimization and characterization of a triazole urea inhibitor for platelet-activating factor acetylhydrolase type 2 (PAFAH2).Adibekian A, Hsu KL, Speers AE, Monillas ES, Brown SJ, Spicer T, Fernandez-Vega V, Ferguson J, Bahnson BJ, Cravatt BF, et al. Probe Reports from the NIH Molecular Libraries Program. 2010
- Characterization of a Selective, Reversible Inhibitor of Lysophospholipase 2 (LY...Characterization of a Selective, Reversible Inhibitor of Lysophospholipase 2 (LYPLA2) - Probe Reports from the NIH Molecular Libraries Program
Your browsing activity is empty.
Activity recording is turned off.
See more...