All rights reserved. This material may be freely reproduced for educational and not-for-profit purposes within the NHS. No reproduction by or for commercial organisations is allowed without the express written permission of the National Institute for Health and Care Excellence.
NCBI Bookshelf. A service of the National Library of Medicine, National Institutes of Health.
Gallstone Disease: Diagnosis and Management of Cholelithiasis, Cholecystitis and Choledocholithiasis. London: National Institute for Health and Care Excellence (NICE); 2014 Oct. (NICE Clinical Guidelines, No. 188.)

Gallstone Disease: Diagnosis and Management of Cholelithiasis, Cholecystitis and Choledocholithiasis.
Show detailsH.1. Review question 1: Signs, symptoms and risk factors for gallstone disease
Insufficient information was available for data analysis.
H.2. Review question 2: Diagnosing gallstone disease
Results for diagnosing gallbladder stones
| Sens (95% CI) | Spec (95% CI) | +LR (95% CI) | -LR (95% CI) | AUC | Log Likelihood | AIC | BIC | |
|---|---|---|---|---|---|---|---|---|
| US 1 study Ahmed | 1.00 (1.00, 1.00) | 0.14 (0.11, 0.17) | 1.16 (1.13, 1.20) | 0.01 (0.00, 0.02) | 0.87 | 26.32 | -42.64 | -43.68 |
Results for diagnosing cholecystitis
| Sens (95% CI) | Spec (95% CI) | +LR (95% CI) | -LR (95% CI) | AUC | Log Likelihood | AIC | BIC | |
|---|---|---|---|---|---|---|---|---|
| MRCP 1 study Hakansson | 0.89 (0.70, 0.96) | 0.89 (0.50, 0.99) | 13.10 (1.72, 56.70) | 0.16 (0.04, 0.40) | 0.88 | 4.60 | 0.81 | -5.73 |
| US 3 studies De Vargas, Hakansson, Park | 0.71 (0.28, 0.94) | 0.88 (0.64, 0.97) | 6.37 (2.07, 16.50) | 0.36 (0.08, 0.79) | 0.89 | 5.95 | -1.91 | -2.95 |
| MRI 1 study Altun | 0.95 (0.71, 0.99) | 0.69 (0.41, 0.88) | 3.41 (1.51, 7.74) | 0.12 (0.01, 0.46) | 0.94 | 4.55 | 0.91 | -5.62 |
| CT 1 study De Vargas | 0.95 (0.53, 1.00) | 0.88 (0.27, 0.99) | 20.80 (1.18, 124.00) | 0.14 (0.00, 0.70) | 0.94 | 5.26 | -0.52 | -7.05 |
H.3. Results for diagnosing common bile duct stones
| Sens (95%CI) | Spec (95%CI) | +LR (95%CI) | -LR (95%CI) | AUC | Log Likelihood | AIC | BIC | |
|---|---|---|---|---|---|---|---|---|
| MRCP 8 studies Chan, Regan, Soto (2002), Griffin, Kondo, Stiris, Sugiyams (1998) | 0.83 (0.72, 0.91) | 0.90 (0.83, 0.95) | 9.15 (4.64, 16.60) | 0.19 (0.10, 0.32) | 0.64 | 16.27 | -22.54 | -18.68 |
| US 5 studies Regan, Riskes, Sugiyama (1997), Sugiyama (1998) Jovanovic (2011) | 0.70 (0.52, 0.83) | 0.88 (0.63, 0.97) | 9.80 (5.39, 16.60) | 0.41 (0.32, 0.50) | 0.83 | 9.56 | -9.12 | -7.61 |
| EUS 3 studies Kondo, Polkowski, Sugiyama (1997) | 0.94 (0.87, 0.97) | 0.94 (0.41, 1.00) | 51.70 (1.62, 321.00) | 0.08 (0.03, 0.16) | 0.95 | 11.32 | -12.65 | -13.69 |
| CTC 4 studies Kondo, Soto (2000) Stoto (1999), Polkowski | 0.82 (0.67, 0.91) | 0.84 (0.72, 0.92) | 5.42 (2.78, 9.92) | 0.23 (0.11, 0.40) | 0.18 | 8.91 | -7.81 | -7.41 |
| CT 3 studies Sugiyama (1997), Tseng, Soto (2000) | 0.76 (0.69, 0.81) | 0.90 (0.66, 0.97) | 9.32 (2.32, 28.30) | 0.28 (0.22, 0.36) | 0.79 | 7.38 | -4.76 | -5.80 |
H.4. Review question 3: Predicting which people with asymptomatic gallbladder stones will develop complications
Insufficient information was available for data analysis
H.5. Review question 4a: Managing asymptomatic gallbladder stones
No evidence was identified for this review question
H.6. Review question 4b Managing symptomatic gallbladder stones
H.6.1. Laparoscopic cholecystectomy vs Laparoscopic cholecystectomy plus intraoperative cholangiography
Outcome 1. Bile leak
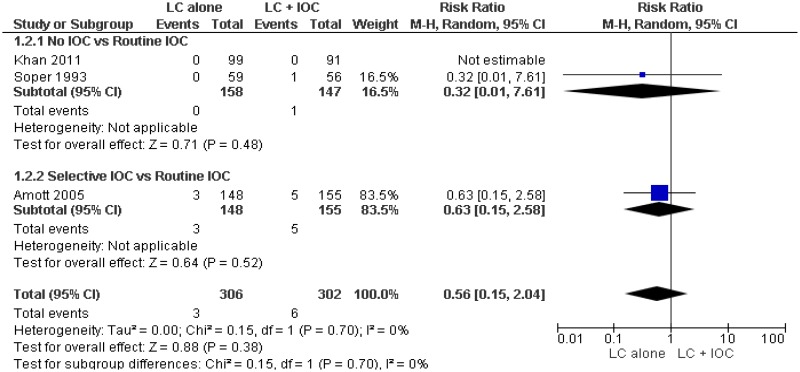
One study (Soper, 1993) reports that both groups had zero bile duct injuries. Unable to analyse zero event data.
Outcome 3. Length of stay
One study (Soper 1993) reports that both groups had a mean length of stay of 1 day. No measures of dispersion are reported.
H.6.2. Laparoscopic cholecystectomy compared to cholecystostomy
No evidence was found
H.6.3. Laparoscopic cholecystectomy compared to conservative management
Outcome 2. Aditional intervention required (cholecystectomy)
45/102 (44.1%) in the conservative management group required cholecystectomy
Outcome 4. Length of stay
Not reported
H.6.4. Day case laparoscopic cholecystectomy compared to planned inpatient laparoscopic cholecystectomy
Outcome 1. Failed day case discharge
18/149 (12.1%) of patients in the day case arm had an unplanned inpatient admission.
Outcome 3. Length of stay
Data could not be pooled:
- 31/71 day case patients required prolonged hospitalisation of 2 days or more
- 48/52 day case patients were discharged within 4-6 hrs (4 patients were admitted),
- 42/48 inpatients were discharged on the first day after surgery
- 6/48 inpatients were discharged on the second day after surgery
- post surgical length of stay was Mean=7.2 SD= 0.8 hrs for the day case group and Mean =31 SD=3 for the inpatient group
Outcome 4. Mortality
Not reported
H.7. Review question 4c Managing common bile duct stones
H.7.1. ERCP + Laparoscopic cholecystectomy compared to ERCP alone
Outcome 1. Quality of life
Not reported
Outcome 4. Additional intervention required (cholecystectomy)
38/148 (25.7%) of people receiving ERCP alon required cholecystectomy
H.7.2. ERCP compared to conservative management
H.7.3. Biliary stent compared to cleared duct
Outcome 5. Length of stay
Not reported
H.7.4. Day case ERCP compared to planned inpatient ERCP
No evidence found
H.7.5. ERCP with laparoscopic cholecystectomy compared to bile duct exploration with laparoscopic cholecystectomy
Outcome 1. Length of stay
Random-effects model preferred to fixed-effects (not shown) because of superior fit to data (DIC = 15.386 versus 349.374).
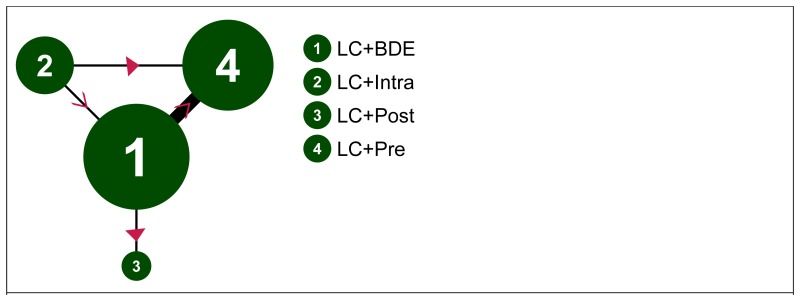
Length of stay (days; loglogistic estimation) – evidence network
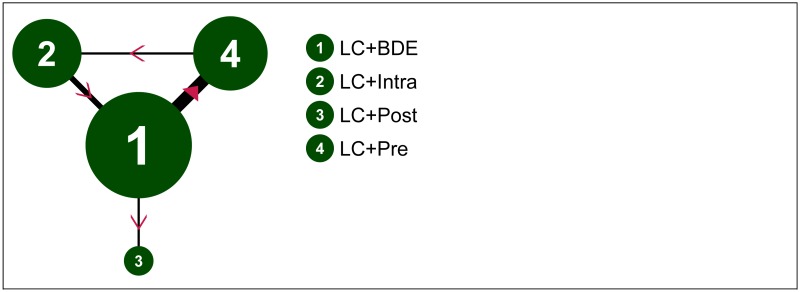
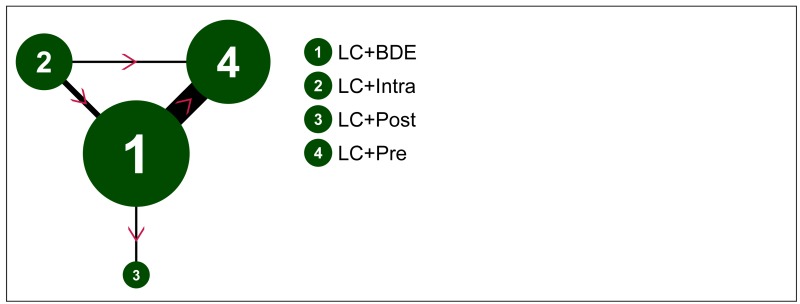
Size of nodes is proportional to total number of participants randomised to receive the treatment in question across the evidence-base. Width of connecting lines is proportional to number of trial-level comparisons available. Arrowheads indicate direction of effect in pairwise data (a > b denotes a is more effective than b) – filled arrowheads show comparisons where one option is significantly superior (p<0.05); outlined arrowheads show direction of trend where effect does not reach statistical significance.
Length of stay (days; loglogistic estimation) – input data
| LC+BDE | LC+Intra | LC+Post | LC+Pre | |
|---|---|---|---|---|
| ElGeidie,A.A. et al. (2011) | 1.30 (0.50) | 3.00 (1.50) | ||
| Bansal,V.K. et al. (2010) | 4.20 (1.50) | 4.00 (2.25) | ||
| Rogers,S.J. et al. (2010) | 5.30 (3.20) | 6.60 (4.00) | ||
| Noble,H. et al. (2009) | 5.00 (1.25) | 3.00 (1.25) | ||
| Hong,D.F. et al. (2006) | 4.66 (3.07) | 4.25 (3.46) | ||
| Cuschieri,A. et al. (1999) | 7.09 (1.30) | 10.63 (1.42) | ||
| Rhodes,M. et al. (1998) | 1.00 (6.25) | 3.50 (2.50) |
Values given are mean length of stay in days (SD)
Length of stay (days; loglogistic estimation) – relative effectiveness of all pairwise combinations
| LC +BDE | LC +Intra | LC +Post | LC +Pre | |
|---|---|---|---|---|
| LC+BDE | -0.41 (-1.28, 0.46) | 2.50 (0.41, 4.59) | 0.66 (-2.78, 4.11) | |
| LC+Intra | -0.68 (-3.21, 1.88) | - | 1.70 (1.39, 2.01) | |
| LC+Post | 2.53 (-1.40, 6.44) | 3.22 (-1.52, 7.86) | - | |
| LC+Pre | 0.75 (-0.88, 2.36) | 1.44 (-1.09, 3.95) | -1.77 (-5.99, 2.48) |
Values given are mean differences.
The segment below and to the left of the shaded cells is derived from the network meta-analysis, reflecting direct and indirect evidence of treatment effects (row versus column). The point estimate reflects the median of the posterior distribution, and numbers in parentheses are 95% credible intervals. The segment above and to the right of the shaded cells gives pooled direct evidence (random-effects pairwise meta-analysis), where available (column versus row). Numbers in parentheses are 95% confidence intervals.
Length of stay (days; loglogistic estimation) – relative effect of all options versus common comparator
Values greater than 0 favour LC+BDE; values less than 0 favour the comparator treatment. Solid error bars are 95% credible intervals; dashed error bars are 95% confidence interval.
Length of stay (days; loglogistic estimation) – rankings for each comparator
| Probability best | Median rank (95%CI) | |
|---|---|---|
| LC+BDE | 0.239 | 2 (1, 3) |
| LC+Intra | 0.668 | 1 (1, 4) |
| LC+Post | 0.056 | 4 (1, 4) |
| LC+Pre | 0.038 | 3 (1, 4) |
Length of stay (days; loglogistic estimation) – model fit statistics
| Residual deviance | Dbar | Dhat | pD | DIC | tau |
|---|---|---|---|---|---|
| 13.84 (compared to 14 datapoints) | 1.702 | -11.981 | 13.684 | 15.386 | 1.693 (95%CI: 1.148, 1.985) |
Outcome 2. Missed common bile duct stones
Fixed-effects model preferred over random-effects (not shown) as simpler and negligible difference in model fit (FE DIC = 66.092; RE DIC = 66.659).
0.5 added to zero cells in synthesis.
Missed CBDS – evidence network
Size of nodes is proportional to total number of participants randomised to receive the treatment in question across the evidence-base. Width of connecting lines is proportional to number of trial-level comparisons available. Arrowheads indicate direction of effect in pairwise data (a > b denotes a is more effective than b) – filled arrowheads show comparisons where one option is significantly superior (p<0.05); outlined arrowheads show direction of trend where effect does not reach statistical significance.
Missed CBDS – input data
| LC+BDE | LC+Intra | LC+Post | LC+Pre | |
|---|---|---|---|---|
| Ding,G. et al. (2014) | 1/44 | 7/36 | ||
| ElGeidie,A.A. et al. (2011) | 2/97 | 9/95 | ||
| ElGeidie,A.A. et al. (2011) | 4/112 | 0/111 | ||
| Noble,H. et al. (2009) | 0/90 | 0/100 | ||
| Koc,B. et al. (2013) | 2/57 | 3/54 | ||
| Hong,D.F. et al. (2006) | 3/141 | 1/93 | ||
| Nathanson,L.K. et al. (2005) | 1/41 | 2/45 | ||
| Sgourakis,G. & (2002) | 1/36 | 1/42 |
Missed CBDS – relative effectiveness of all pairwise combinations
| LC +BDE | LC +Intra | LC +Post | LC +Pre | |
|---|---|---|---|---|
| LC+BDE | 0.24 (0.04, 1.38) | 1.86 (0.16, 21.32) | 3.76 (1.49, 9.44) | |
| LC+Intra | 0.28 (0.04, 1.23) | - | 0.90 (0.02, 45.85) | |
| LC+Post | 2.28 (0.17, 72.80) | 8.88 (0.41, 429.40) | - | |
| LC+Pre | 3.64 (1.54, 9.86) | 13.20 (2.43, 117.40) | 1.59 (0.04, 25.28) |
Values given are odds ratios.
The segment below and to the left of the shaded cells is derived from the network meta-analysis, reflecting direct and indirect evidence of treatment effects (row versus column). The point estimate reflects the median of the posterior distribution, and numbers in parentheses are 95% credible intervals. The segment above and to the right of the shaded cells gives pooled direct evidence (random-effects pairwise meta-analysis), where available (column versus row). Numbers in parentheses are 95% confidence intervals.
Missed CBDS – relative effect of all options versus common comparator
Values greater than 1 favour LC+BDE; values less than 1 favour the comparator treatment. Solid error bars are 95% credible intervals; dashed error bars are 95% confidence interval.
Missed CBDS – rankings for each comparator
| Probability best | Median rank (95%CI) | |
|---|---|---|
| LC+BDE | 0.035 | 2 (1, 3) |
| LC+Intra | 0.885 | 1 (1, 2) |
| LC+Post | 0.080 | 3 (1, 4) |
| LC+Pre | 0.000 | 4 (3, 4) |
Missed CBDS – model fit statistics
| Residual deviance | Dbar | Dhat | pD | DIC |
|---|---|---|---|---|
| 16.82 (compared to 16 datapoints) | 55.579 | 45.066 | 10.513 | 66.092 |
Outcome 3. Failed procedure
Random-effects model preferred to fixed-effects (not shown) because of somewhat improved fit to data (DIC = 110.143 versus 115.052).
0.5 added to zero cells in synthesis.
Failed procedure – evidence network
Size of nodes is proportional to total number of participants randomised to receive the treatment in question across the evidence-base. Width of connecting lines is proportional to number of trial-level comparisons available. Arrowheads indicate direction of effect in pairwise data (a > b denotes a is more effective than b) – filled arrowheads show comparisons where one option is significantly superior (p<0.05); outlined arrowheads show direction of trend where effect does not reach statistical significance.
Failed procedure – input data
| LC+BDE | LC+Intra | LC+Post | LC+Pre | |
|---|---|---|---|---|
| Ding,G. et al. (2014) | 0/44 | 14/47 | ||
| ElGeidie,A.A. et al. (2011) | 7/110 | 6/111 | ||
| ElGeidie,A.A. et al. (2011) | 6/115 | 3/111 | ||
| Bansal,V.K. et al. (2010) | 2/98 | 5/93 | ||
| Rogers,S.J. et al. (2010) | 1/15 | 4/15 | ||
| Noble,H. et al. (2009) | 2/57 | 1/55 | ||
| Koc,B. et al. (2013) | 2/57 | 3/54 | ||
| Hong,D.F. et al. (2006) | 15/141 | 8/93 | ||
| Sgourakis,G. & (2002) | 4/28 | 5/32 | ||
| Cuschieri,A. et al. (1999) | 1/133 | 7/136 | ||
| Rhodes,M. et al. (1998) | 10/40 | 10/40 |
Failed procedure – relative effectiveness of all pairwise combinations
| LC +BDE | LC +Intra | LC +Post | LC +Pre | |
|---|---|---|---|---|
| LC+BDE | 0.69 (0.32, 1.48) | 1.00 (0.36, 2.75) | 2.01 (0.81, 5.00) | |
| LC+Intra | 0.68 (0.14, 3.23) | - | 2.73 (0.52, 14.42) | |
| LC+Post | 0.98 (0.08, 11.41) | 1.44 (0.08, 26.99) | - | |
| LC+Pre | 2.54 (0.96, 7.40) | 3.72 (0.73, 21.02) | 2.58 (0.19, 39.89) |
Values given are odds ratios.
The segment below and to the left of the shaded cells is derived from the network meta-analysis, reflecting direct and indirect evidence of treatment effects (row versus column). The point estimate reflects the median of the posterior distribution, and numbers in parentheses are 95% credible intervals. The segment above and to the right of the shaded cells gives pooled direct evidence (random-effects pairwise meta-analysis), where available (column versus row). Numbers in parentheses are 95% confidence intervals.
Failed procedure – relative effect of all options versus common comparator
Values greater than 1 favour LC+BDE; values less than 1 favour the comparator treatment. Solid error bars are 95% credible intervals; dashed error bars are 95% confidence interval.
Failed procedure – rankings for each comparator
| Probability best | Median rank (95%CI) | |
|---|---|---|
| LC+BDE | 0.138 | 2 (1, 3) |
| LC+Intra | 0.516 | 1 (1, 4) |
| LC+Post | 0.342 | 2 (1, 4) |
| LC+Pre | 0.004 | 4 (2, 4) |
Failed procedure – model fit statistics
| Residual deviance | Dbar | Dhat | pD | DIC | tau |
|---|---|---|---|---|---|
| 22.71 (compared to 22 datapoints) | 91.416 | 72.69 | 18.726 | 110.143 | 0.973 (95%CI: 0.172, 1.877) |
Outcome 4. Conversion to open surgery
Random-effects model preferred to fixed-effects (not shown) because of somewhat improved fit to data (DIC = 91.58 versus 95.091).
0.5 added to zero cells in synthesis.
Conversion to open surgery – evidence network
Size of nodes is proportional to total number of participants randomised to receive the treatment in question across the evidence-base. Width of connecting lines is proportional to number of trial-level comparisons available. Arrowheads indicate direction of effect in pairwise data (a > b denotes a is more effective than b) – filled arrowheads show comparisons where one option is significantly superior (p<0.05); outlined arrowheads show direction of trend where effect does not reach statistical significance.
Conversion to open surgery – input data
| LC+BDE | LC+Intra | LC+Post | LC+Pre | |
|---|---|---|---|---|
| Ding,G. et al. (2014) | 4/44 | 2/47 | ||
| ElGeidie,A.A. et al. (2011) | 3/110 | 1/111 | ||
| ElGeidie,A.A. et al. (2011) | 7/115 | 4/111 | ||
| Bansal,V.K. et al. (2010) | 2/91 | 2/85 | ||
| Noble,H. et al. (2009) | 1/15 | 2/15 | ||
| Koc,B. et al. (2013) | 0/57 | 1/54 | ||
| Hong,D.F. et al. (2006) | 15/141 | 8/93 | ||
| Sgourakis,G. & (2002) | 1/36 | 5/42 | ||
| Cuschieri,A. et al. (1999) | 17/133 | 8/133 | ||
| Rhodes,M. et al. (1998) | 1/40 | 0/40 |
Conversion to open surgery – relative effectiveness of all pairwise combinations
| LC +BDE | LC +Intra | LC +Post | LC +Pre | |
|---|---|---|---|---|
| LC+BDE | 0.71 (0.34, 1.48) | 0.33 (0.01, 8.22) | 0.75 (0.32, 1.74) | |
| LC+Intra | 0.69 (0.20, 2.33) | - | 1.07 (0.15, 7.79) | |
| LC+Post | 0.18 (0.00, 8.04) | 0.25 (0.00, 13.83) | - | |
| LC+Pre | 0.78 (0.35, 2.27) | 1.13 (0.32, 5.35) | 4.54 (0.10, 2560.00) |
Values given are odds ratios.
The segment below and to the left of the shaded cells is derived from the network meta-analysis, reflecting direct and indirect evidence of treatment effects (row versus column). The point estimate reflects the median of the posterior distribution, and numbers in parentheses are 95% credible intervals. The segment above and to the right of the shaded cells gives pooled direct evidence (random-effects pairwise meta-analysis), where available (column versus row). Numbers in parentheses are 95% confidence intervals.
Conversion to open surgery – relative effect of all options versus common comparator
Values greater than 1 favour LC+BDE; values less than 1 favour the comparator treatment. Solid error bars are 95% credible intervals; dashed error bars are 95% confidence interval.
Conversion to open surgery – rankings for each comparator
| Probability best | Median rank (95%CI) | |
|---|---|---|
| LC+BDE | 0.019 | 3 (2, 4) |
| LC+Intra | 0.166 | 2 (1, 4) |
| LC+Post | 0.722 | 1 (1, 4) |
| LC+Pre | 0.094 | 3 (1, 4) |
Conversion to open surgery – model fit statistics
| Residual deviance | Dbar | Dhat | pD | DIC | tau |
|---|---|---|---|---|---|
| 19.86 (compared to 20 datapoints) | 76.68 | 61.781 | 14.9 | 91.58 | 0.542 (95%CI: 0.010, 1.692) |
Outcome 5. More than 1 ERCP required to clear bile duct
Pre operative ERCP- Bansal 2/15, Cuscheri 7/150 = 5% overall
Intra operative ERCP- not reported
Post operative ERCP- Nathanson 11/45, Rhodes 7/40 = 21% overall
H.8. Review question 5 Timing of intervention
H.8.1. Early laparoscopic cholecystectomy compared to delayed laparoscopic cholecystectomy for acute cholecystitis
Outcome 2. Readmission due to surgical complications
Not reported
Outcome 3. Length of stay, with sensitivity analysis for methods for calculating Mean and Standard Deviation (Lau Loglogistic with Hozo SD used in final analysis)
Outcome 4. Mortality
This outcome was reported by all four included studies, but no deaths were observed in any arm in any study.
H.8.2. Early compared to delayed laparoscopic cholecystectomy after ERCP for common bile duct stones
Outcome 1. Readmission due to symptoms
Not reported
Outcome 2. Readmission due to surgical complications
Not reported
Outcome 3. Length of stay, with sensitivity analysis for methods for calculating Mean and Standard Deviation (Lau Loglogistic with Hozo SD used in final analysis)
Outcome 4. Mortality
This outcome was reported but zero events happened in both arms.
Outcome 5. Quality of life
Not reported
H.9. Review question 6 Patient information
Themes
- Diet
- 83% said they received no post-operative dietary advice, yet many were able to state foods that were best avoided. (Blay, 2006)
- 13% requested additional information on diet (Blay, 2006)
- 4/23 patients requested additional information on diet (Blay, 2005)
- Pain
- 7/23 patients requested more information on pain management (Blay, 2005)
- Wounds
- Respondents had many questions about how their wounds should be cared for and how the wounds should normally look (Barthelsson, 2003)
- 5/23 patients requested more information about wounds (Blay, 2005)
- Resuming activity
- 65% of patients had not been told about how long it would take to resume normal activities. (Blay, 2006)
- 2/23 patients requested additional information on activity (Blay, 2005)
- 6% of patients requested additional information on post operative activity (Blay 2006)
- Waiting for elective surgery
- Some patients resign themselves to the wait, whereas others attempt to speed up treatment, look for information on the disease or treatment alternatives, or seek reassurance from relatives or care providers. (Hilkhuysen, 2005)
- General information
- 14% said they received no information from PAC nurse (Blay, 2006)
- Several respondents had no memory of the information given by the surgeon on discharge from hospital (Barthelsson, 2003)
- Patients were not given definitive advice on how long they should expect to be in hospital. (Blay, 2006)
- Patient's knowledge of the disease and its natural course was considered to be important, as sufficient knowledge would prevent patients from restricting themselves unnecessarily, or experiencing unreasonable distress. (Hilkhuysen, 2005)
- Patients requested additional information on diet, self care after discharge, general preoperative information, postoperative activity, pain management, medical terminology. (Blay, 2006)
- Patients requested additional information on general information, wounds, pain management, dietary advice, bowel management, nausea and vomiting, activity, medications. (Blay, 2005)
- 31% of patients with internet access used it to acquire additional information about their operations and 58% used internet search engines to acquire additional information (Tamahankar, 2009)
- Of the people who searched the internet regarding their operations, 79% rated the information they found as good or very good. 23% were confused or worried about by the information they received (Tamahankar, 2009)
- 31% of people who received routine information would have liked extra information, 36% of people who received routine information plus an information sheet would have liked extra information- study doesn't state what information they wanted to receive. (King, 2004)
- Review question 1: Signs, symptoms and risk factors for gallstone disease
- Review question 2: Diagnosing gallstone disease
- Results for diagnosing common bile duct stones
- Review question 3: Predicting which people with asymptomatic gallbladder stones will develop complications
- Review question 4a: Managing asymptomatic gallbladder stones
- Review question 4b Managing symptomatic gallbladder stones
- Review question 4c Managing common bile duct stones
- Review question 5 Timing of intervention
- Review question 6 Patient information
- Data analysis - Gallstone DiseaseData analysis - Gallstone Disease
Your browsing activity is empty.
Activity recording is turned off.
See more...


