Included under terms of UK Non-commercial Government License.
NCBI Bookshelf. A service of the National Library of Medicine, National Institutes of Health.
Galdas P, Darwin Z, Fell J, et al. A systematic review and metaethnography to identify how effective, cost-effective, accessible and acceptable self-management support interventions are for men with long-term conditions (SELF-MAN). Southampton (UK): NIHR Journals Library; 2015 Aug. (Health Services and Delivery Research, No. 3.34.)
A systematic review and metaethnography to identify how effective, cost-effective, accessible and acceptable self-management support interventions are for men with long-term conditions (SELF-MAN).
Show detailsAnalysis 1: within-Cochrane review analysis forest plots
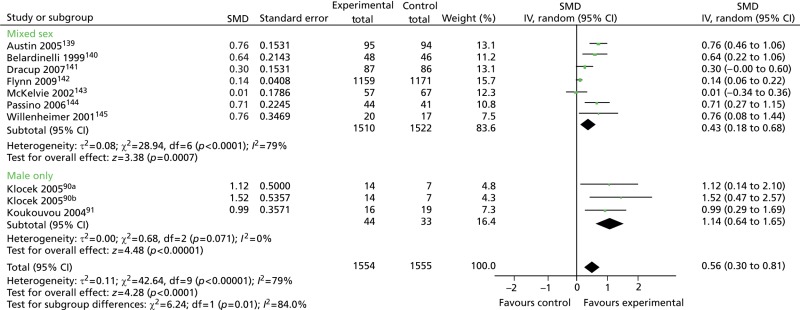
FIGURE 14
Health-related quality-of-life outcomes in male-only vs. mixed-sex groups. Adapted from Davies et al. 2010.146 a and b refer to different intervention groups within the Klocek 2005 study. df, degrees of freedom; IV, inverse variance.
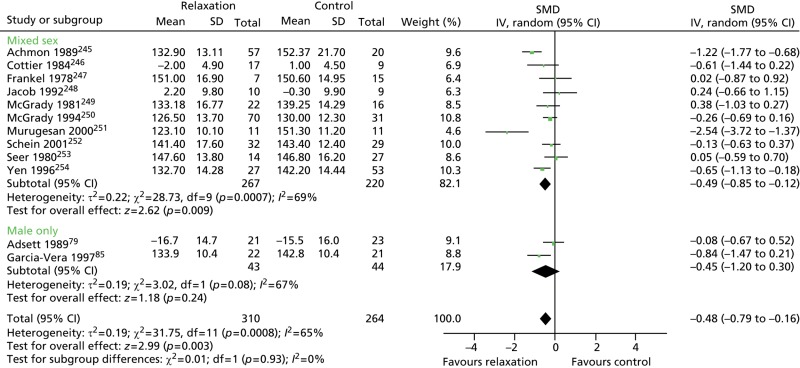
FIGURE 15
Systolic blood pressure (< 6 months’ follow-up) in male-only vs. mixed-sex groups. Adapted from Dickinson et al. 2008.44 df, degrees of freedom; IV, inverse variance; SD, standard deviation.
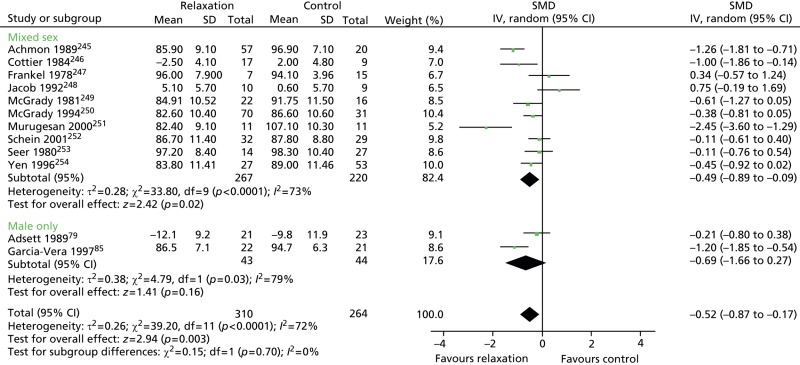
FIGURE 16
Diastolic blood pressure (< 6 months’ follow-up) in male-only vs. mixed-sex groups. Adapted from Dickinson et al. 2008.44 df, degrees of freedom; IV, inverse variance; SD, standard deviation.
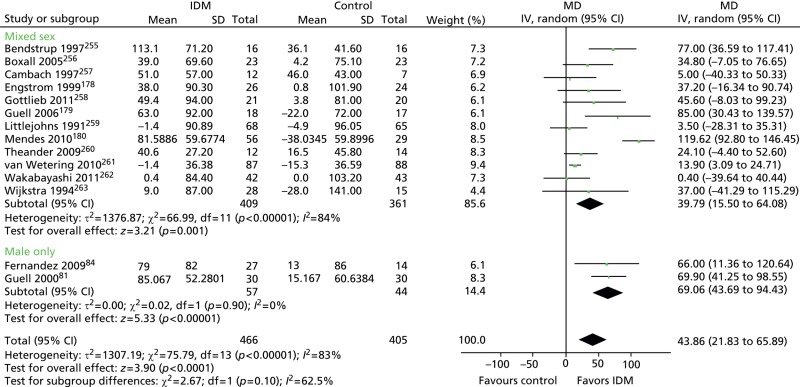
FIGURE 17
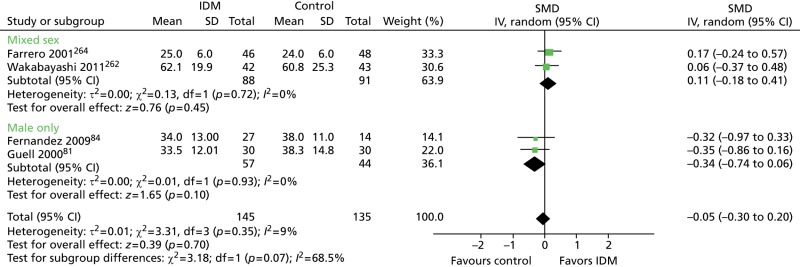
Six-minute walking distance (≤ 12 months) in male-only vs. mixed-sex groups. Adapted from Kruis et al. 2013.43 df, degrees of freedom; IDM, integrated disease management; IV, inverse variance; SD, standard deviation.
FIGURE 18
Forced expiratory volume (% predicted) in male-only vs. mixed-sex groups. Adapted from Kruis et al. 2013.43 df, degrees of freedom; IDM, integrated disease management; IV, inverse variance; SD, standard deviation.
FIGURE 19
Health-related quality-of-life (≤ 6 months) outcomes in male-only vs. mixed-sex and female-only groups. Adapted from Mishra et al. 2012.42 df, degrees of freedom; IV, inverse variance; SD, standard deviation.
FIGURE 20
Fatigue (≤ 6 months) outcomes in male-only vs. mixed-sex and female-only groups. Adapted from Mishra et al. 2012.42 df, degrees of freedom; IV, inverse variance; SD, standard deviation.
Analysis 2: across-Cochrane review analysis
FIGURE 21
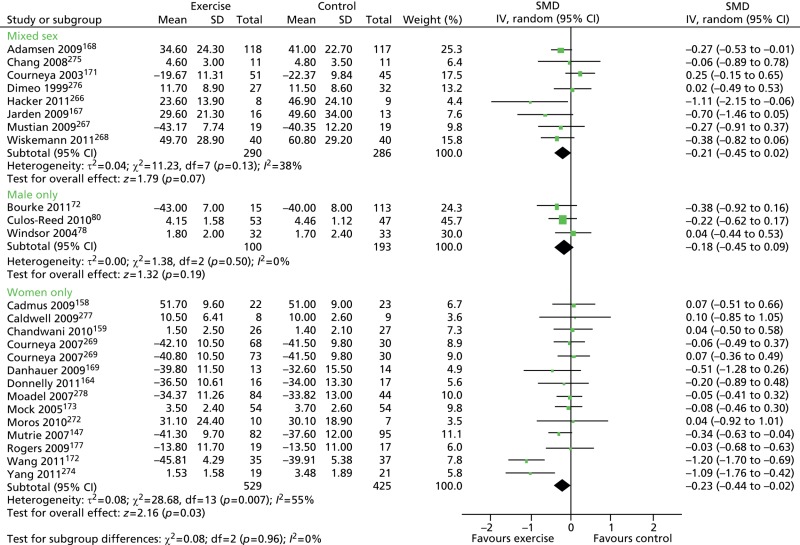
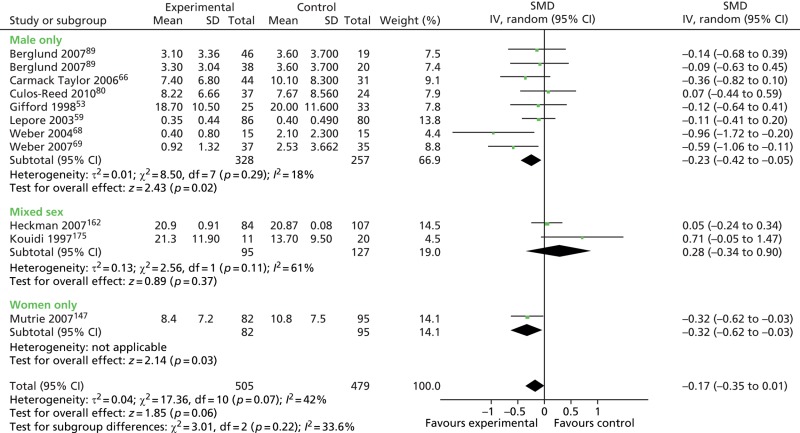
Physical activity interventions: HRQoL outcomes in male-only vs. mixed-sex and female-only groups (mixed disease plot). df, degrees of freedom; IV, inverse variance; SD, standard deviation.
FIGURE 22
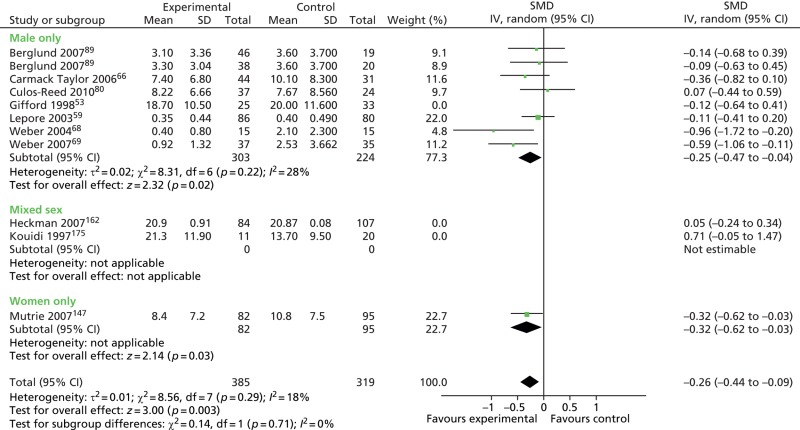
Physical activity interventions: HRQoL outcomes in male-only vs. mixed-sex and female-only groups (cancer-only plot). df, degrees of freedom; IV, inverse variance; SD, standard deviation.

FIGURE 23
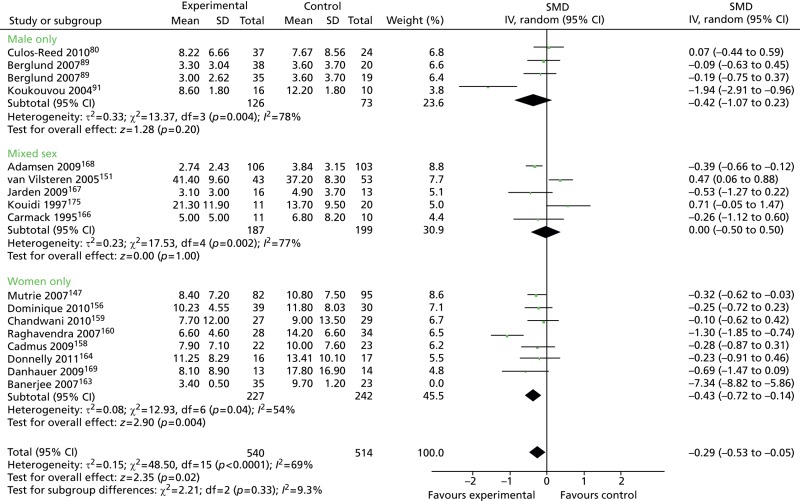
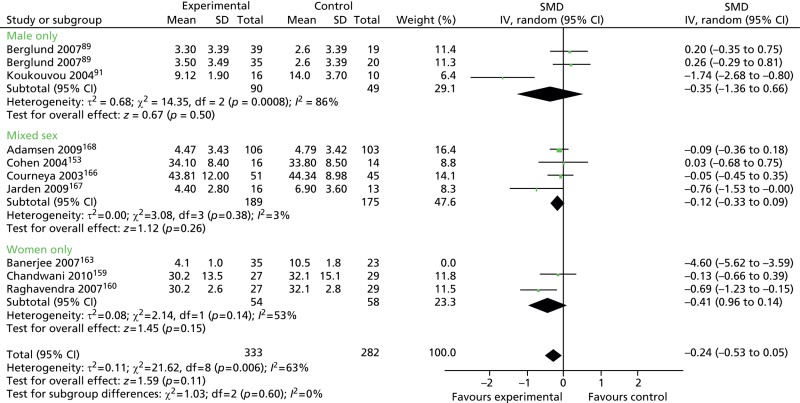
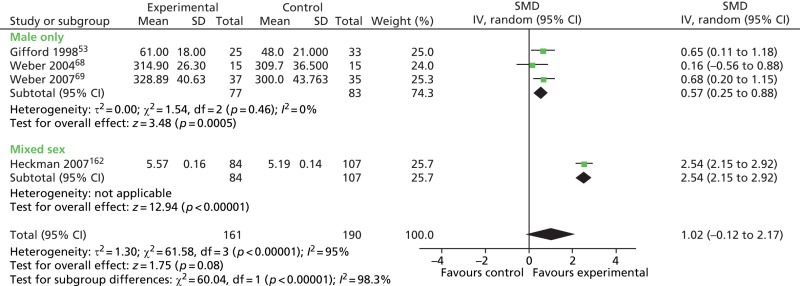
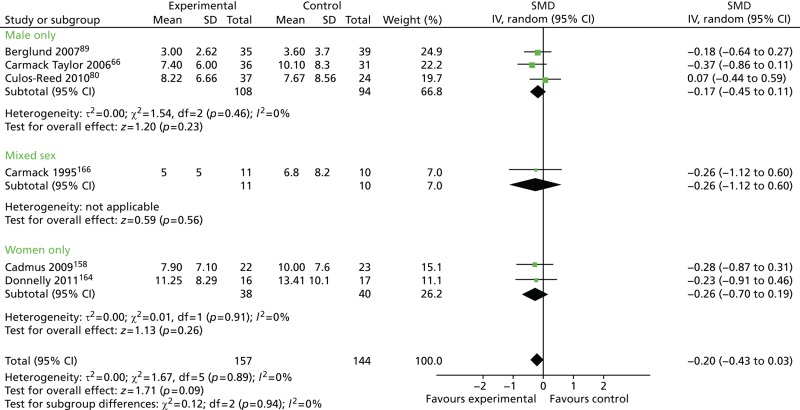
Physical activity interventions: depression outcomes in male-only vs. mixed-sex and female-only groups (mixed disease plot). df, degrees of freedom; IV, inverse variance; SD, standard deviation.
FIGURE 24
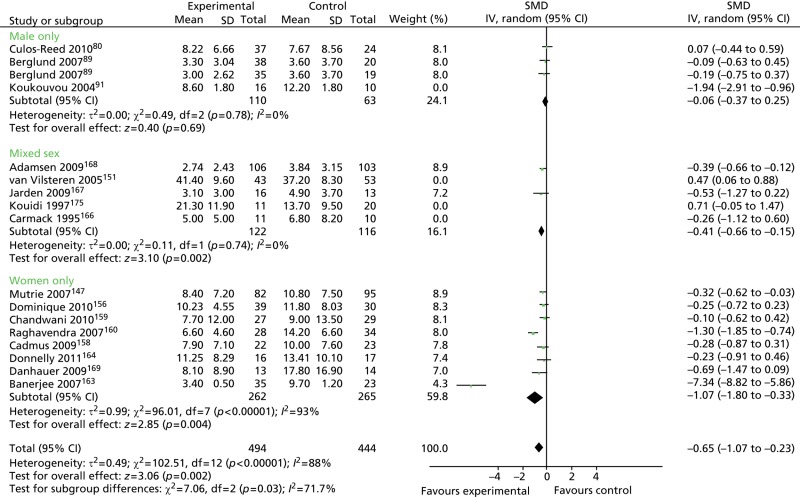
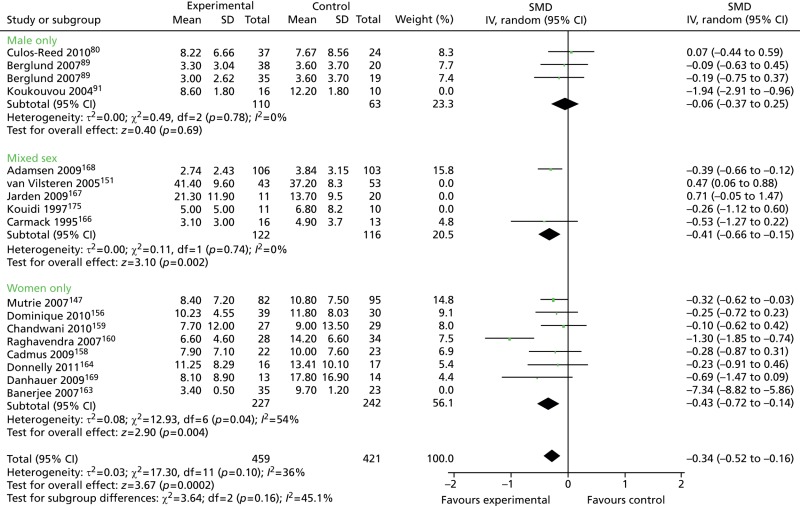
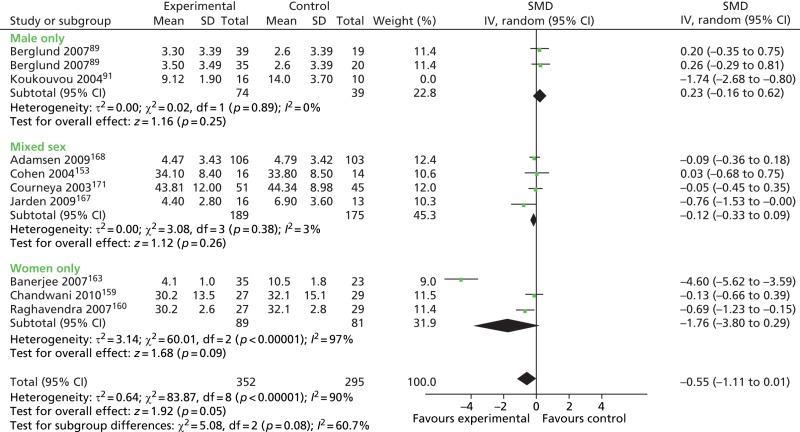
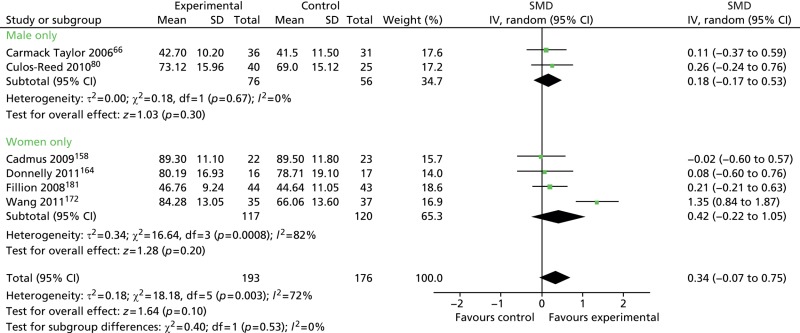
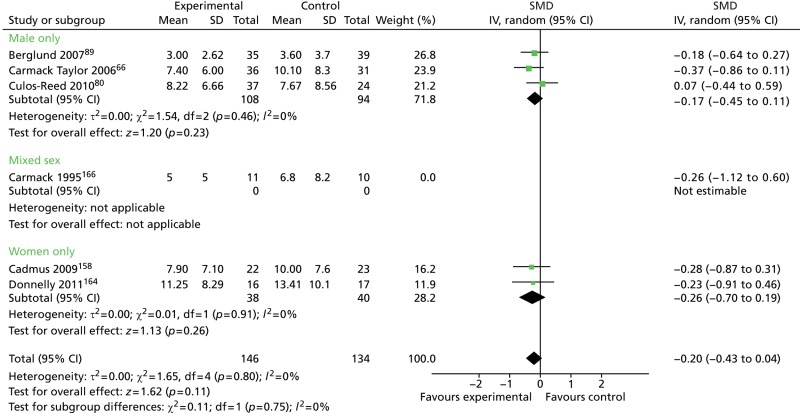
Physical activity interventions: depression outcomes in male-only vs. mixed-sex and female-only groups (mixed disease plot minus outlier Banerjee 2007163). df, degrees of freedom; IV, inverse variance; SD, standard deviation.
FIGURE 25
Physical activity interventions: depression outcomes in male-only vs. mixed-sex and female-only groups (cancer-only plot). df, degrees of freedom; IV, inverse variance; SD, standard deviation.
FIGURE 26
Physical activity interventions: depression outcomes in male-only vs. mixed-sex and female-only groups (cancer-only plot, minus outlier Banerjee 2007163). df, degrees of freedom; IV, inverse variance; SD, standard deviation.
FIGURE 27
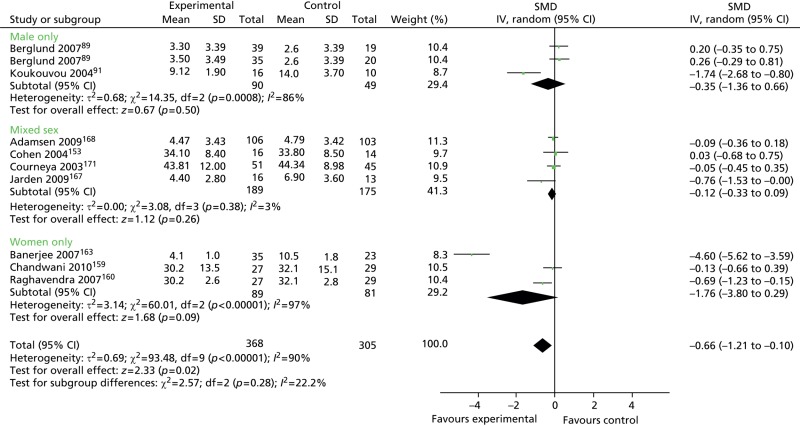
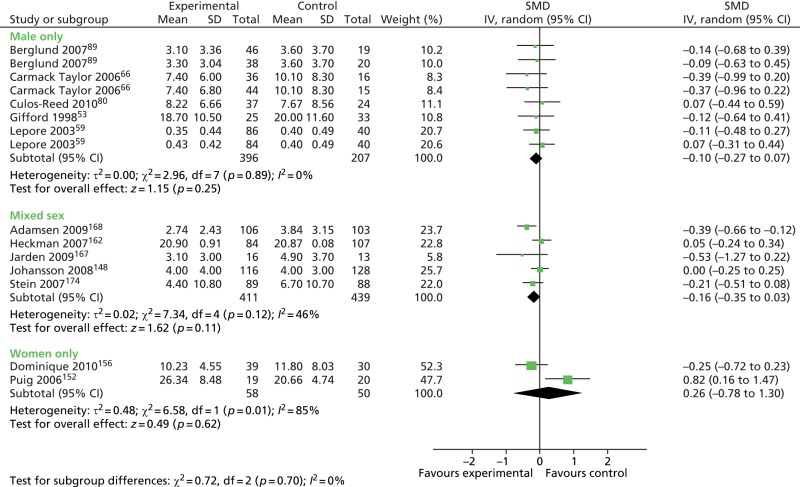
Physical activity interventions: anxiety outcomes in male-only vs. mixed-sex and female-only groups (mixed disease plot). df, degrees of freedom; IV, inverse variance; SD, standard deviation.
FIGURE 28
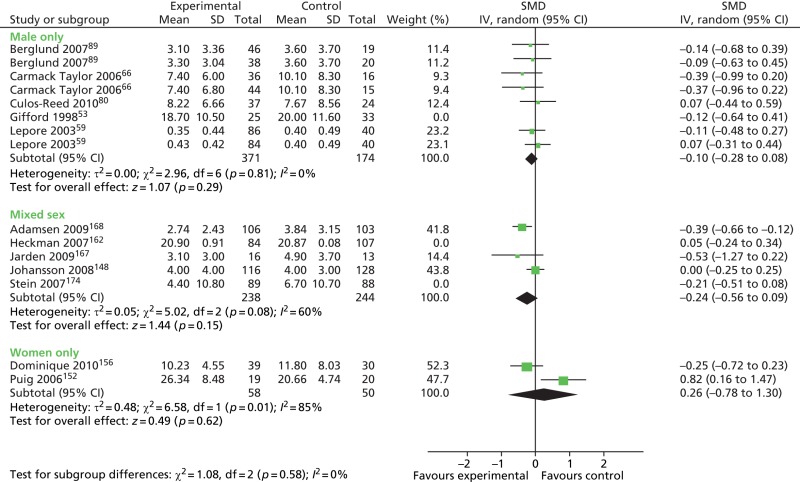
Physical activity interventions: anxiety outcomes in male-only vs. mixed-sex and female-only groups (mixed disease plot, minus outlier Banerjee 2007163). df, degrees of freedom; IV, inverse variance; SD, standard deviation.
FIGURE 29
Physical activity interventions: anxiety outcomes in male-only vs. mixed-sex and female-only groups (cancer-only plot). df, degrees of freedom; IV, inverse variance; SD, standard deviation.
FIGURE 30
Physical activity interventions: anxiety outcomes in male-only vs. mixed-sex and female-only groups (cancer-only plot, minus outlier Banerjee 2007163). df, degrees of freedom; IV, inverse variance; SD, standard deviation.
FIGURE 31
Physical activity interventions: fatigue outcomes in male-only vs. mixed-sex and female-only groups (mixed disease plot). df, degrees of freedom; IV, inverse variance.
FIGURE 32
Physical activity interventions: fatigue outcomes in male-only vs. mixed-sex and female-only groups (cancer-only plot). df, degrees of freedom; IV, inverse variance.
FIGURE 33
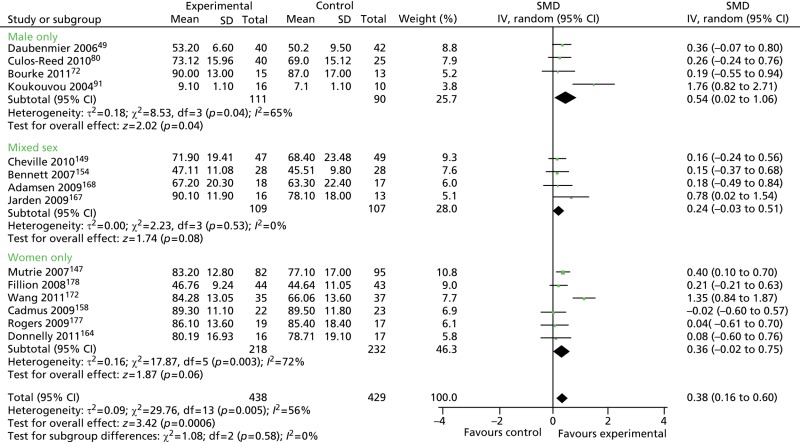
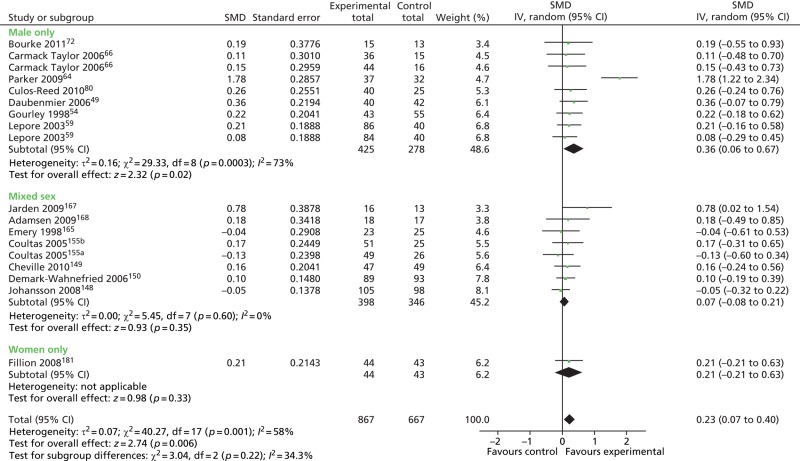
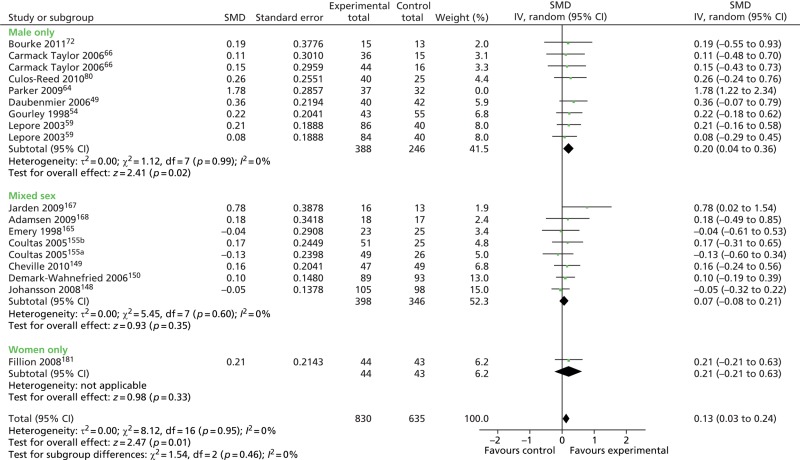
Education interventions: HRQoL outcomes in male-only vs. mixed-sex and female-only groups (mixed disease plot). a and b refer to different intervention groups within the Coultas 2005 study.155 df, degrees of freedom; IV, inverse variance.
FIGURE 34
FIGURE 35
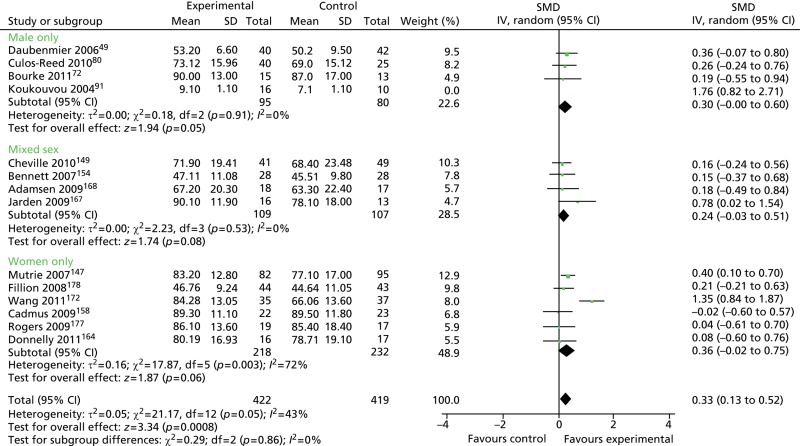
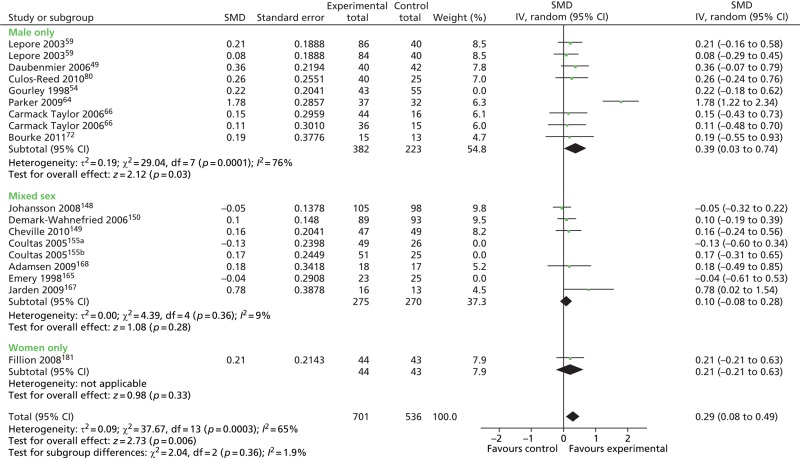
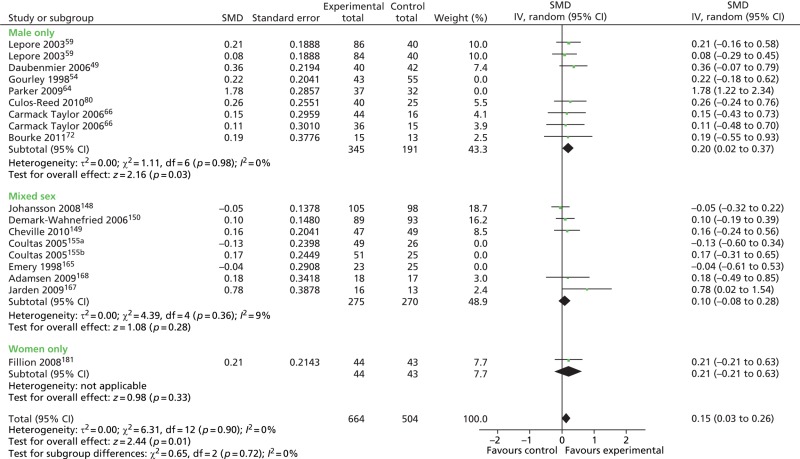
Education interventions: HRQoL outcomes in male-only vs. mixed-sex and female-only groups (cancer-only plot). a and b refer to different intervention groups within the Coultas 2005 study.155 df, degrees of freedom; IV, inverse variance.
FIGURE 36
FIGURE 37
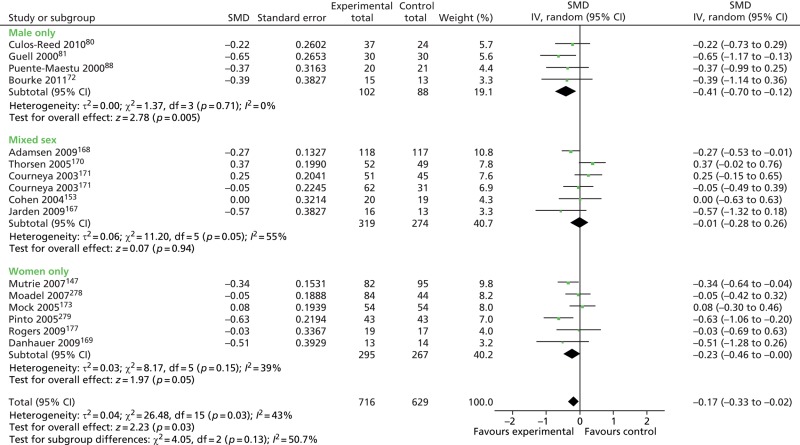
Education interventions: depression outcomes in male-only vs. mixed-sex and female-only groups (mixed disease plot). df, degrees of freedom; IV, inverse variance; SD, standard deviation.
FIGURE 38
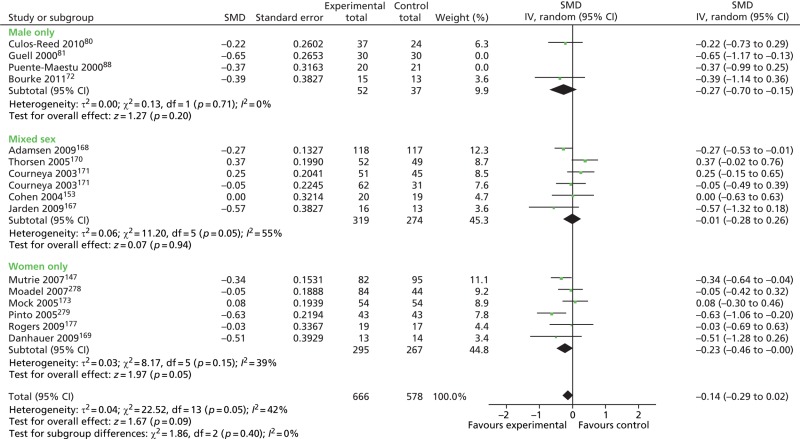
Education interventions: depression outcomes in male-only vs. mixed-sex and female-only groups (cancer-only plot). df, degrees of freedom; IV, inverse variance; SD, standard deviation.
FIGURE 39
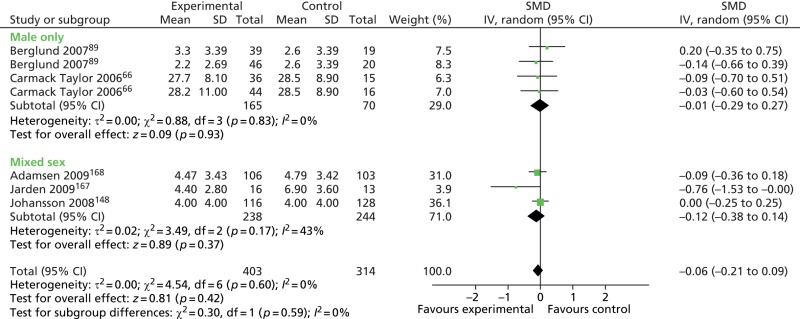
Education interventions: anxiety outcomes in male-only vs. mixed-sex groups (cancer-only plot). df, degrees of freedom; IV, inverse variance; SD, standard deviation.
FIGURE 40
Education interventions: fatigue outcomes in male-only vs. mixed-sex groups (mixed disease plot). df, degrees of freedom; IV, inverse variance.
FIGURE 41
Education interventions: fatigue outcomes in male-only vs. mixed-sex groups (cancer-only plot). df, degrees of freedom; IV, inverse variance.
FIGURE 42
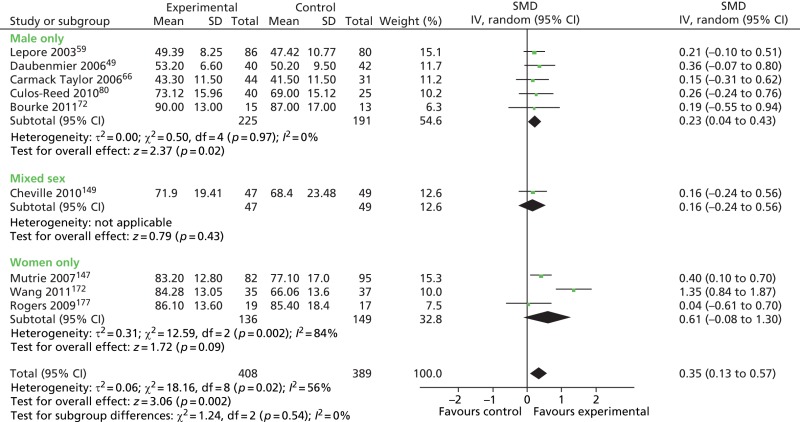
Peer support interventions: HRQoL outcomes in male-only vs. mixed-sex and female-only groups (cancer-only plot). df, degrees of freedom; IV, inverse variance; SD, standard deviation.
FIGURE 43
Peer support interventions: depression outcomes in male-only vs. mixed-sex and female-only groups (mixed disease plot). df, degrees of freedom; IV, inverse variance; SD, standard deviation.
FIGURE 44
Peer support interventions: depression outcomes in male-only vs. mixed-sex and female-only groups (cancer-only plot). df, degrees of freedom; IV, inverse variance; SD, standard deviation.

FIGURE 45
Peer support interventions: fatigue outcomes in male-only vs. female-only groups (mixed disease plot). df, degrees of freedom; IV, inverse variance; SD, standard deviation.

FIGURE 46
Peer support interventions: fatigue outcomes in male-only vs. female-only groups (cancer-only plot). df, degrees of freedom; IV, inverse variance; SD, standard deviation.
FIGURE 47
Peer support interventions: self-efficacy outcomes in male-only vs. mixed-sex groups. df, degrees of freedom; IV, inverse variance; SD, standard deviation.
FIGURE 48
Health-care professional monitoring and feedback: HRQoL outcomes in male-only vs. female-only groups (cancer-only plot). df, degrees of freedom; IV, inverse variance; SD, standard deviation.
FIGURE 49
Health-care professional monitoring and feedback: depression outcomes in male-only vs. mixed-sex and female-only groups (mixed disease plot). df, degrees of freedom; IV, inverse variance; SD, standard deviation.
Analysis 3: male-only by intervention-type analysis
FIGURE 51
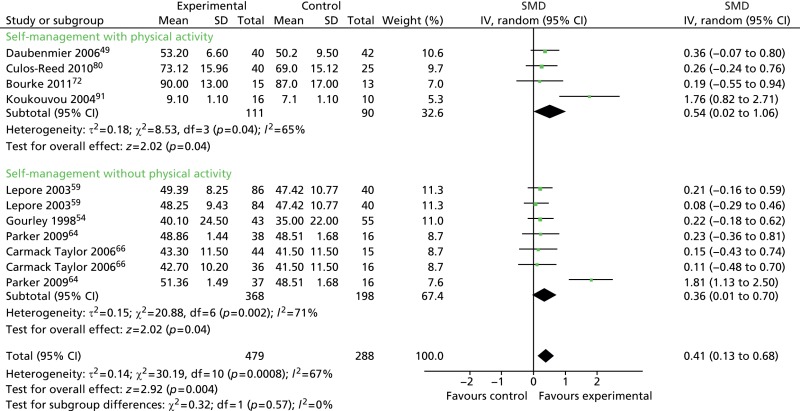
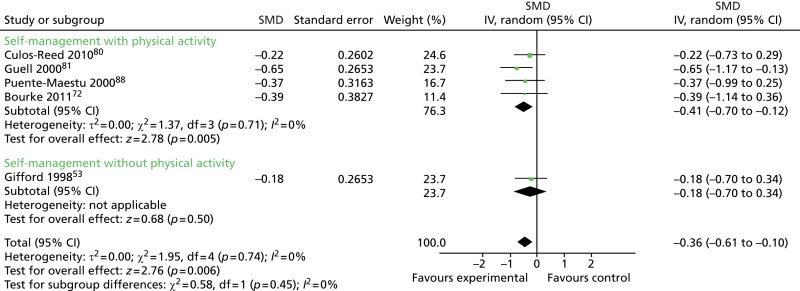
Physical activity vs. no physical activity: HRQoL outcomes. df, degrees of freedom; IV, inverse variance; SD, standard deviation.
FIGURE 52
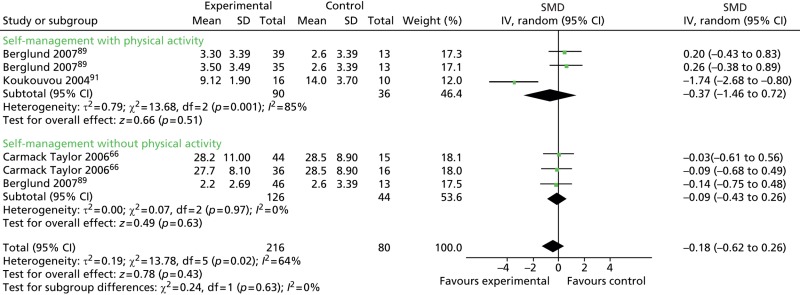
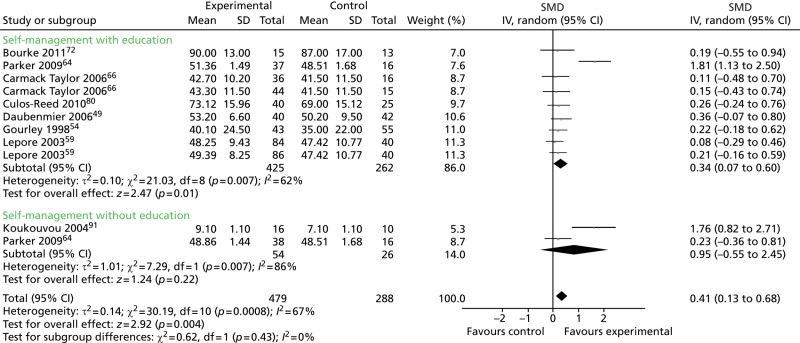
Physical activity vs. no physical activity: depression outcomes. df, degrees of freedom; IV, inverse variance; SD, standard deviation.
FIGURE 53
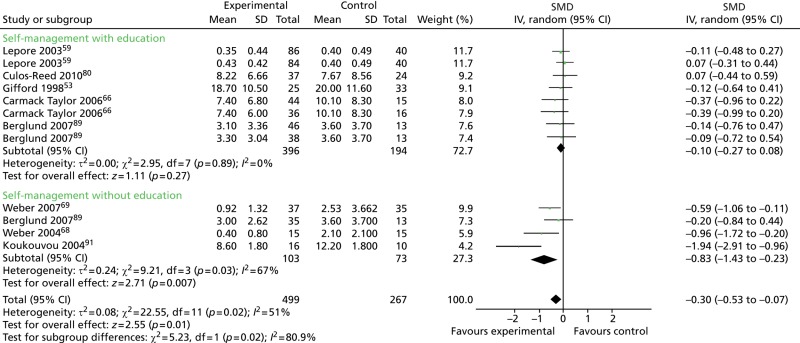
Physical activity vs. no physical activity: anxiety outcomes. df, degrees of freedom; IV, inverse variance; SD, standard deviation.
FIGURE 54
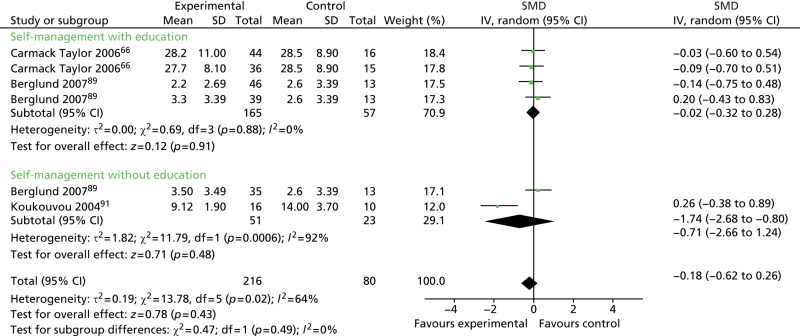
Physical activity vs. no physical activity: fatigue outcomes. df, degrees of freedom; IV, inverse variance.
FIGURE 55
Education vs. no education: HRQoL outcomes. df, degrees of freedom; IV, inverse variance; SD, standard deviation.
FIGURE 56
Education vs. no education: depression outcomes. df, degrees of freedom; IV, inverse variance; SD, standard deviation.
FIGURE 57
Education vs. no education: anxiety outcomes. df, degrees of freedom; IV, inverse variance; SD, standard deviation.
FIGURE 58
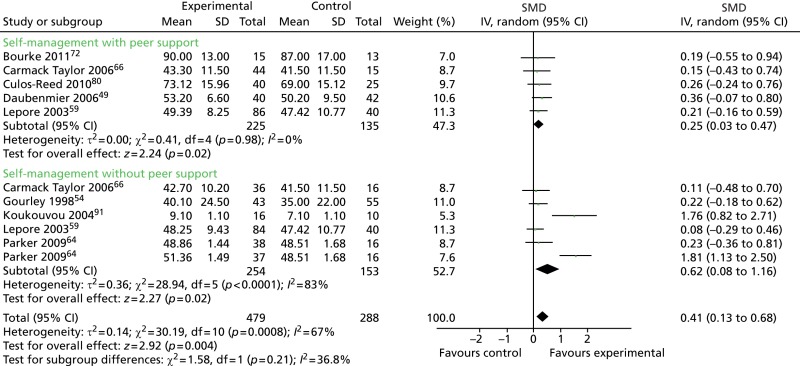
Peer support vs. no peer support: HRQoL outcomes. df, degrees of freedom; IV, inverse variance; SD, standard deviation.
FIGURE 59
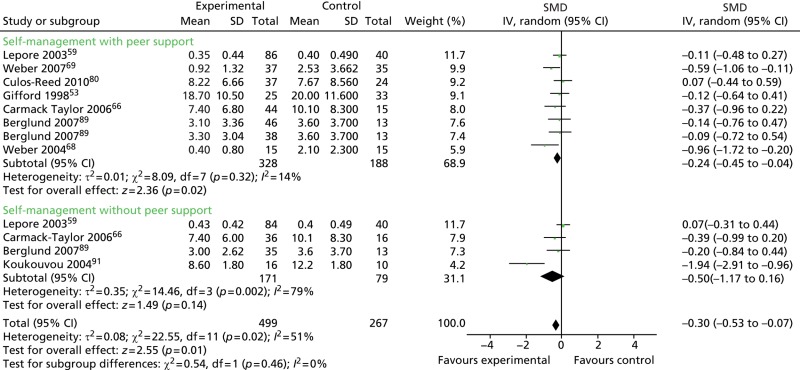
Peer support vs. no peer support: depression outcomes. df, degrees of freedom; IV, inverse variance; SD, standard deviation.
FIGURE 60
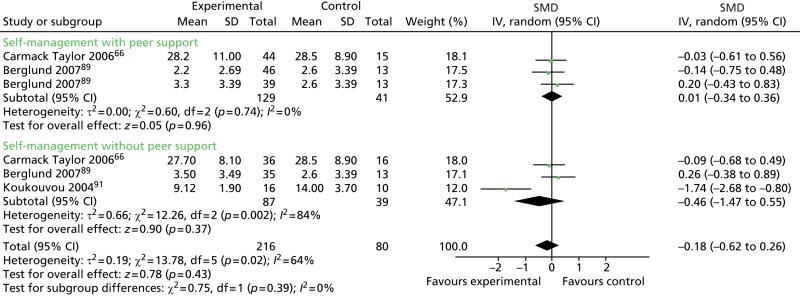
Peer support vs. no peer support: anxiety outcomes. df, degrees of freedom; IV, inverse variance; SD, standard deviation.

FIGURE 61
Peer support vs. no peer support: fatigue outcomes. df, degrees of freedom; IV, inverse variance.
FIGURE 62
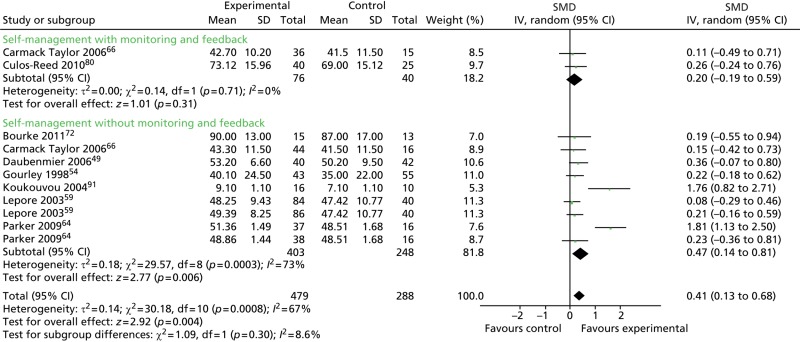
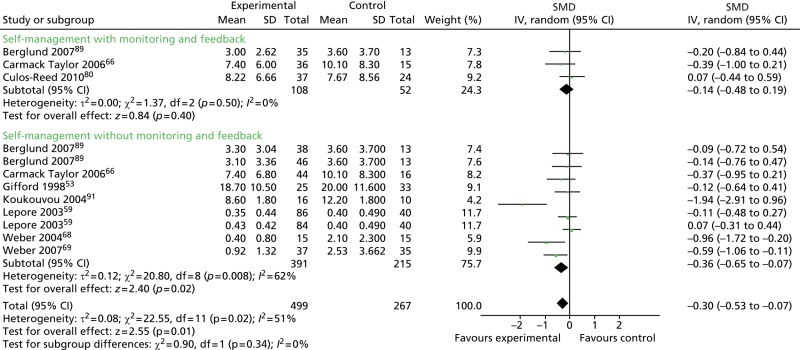
Health-care professional monitoring and feedback vs. no HCP monitoring and feedback: HRQoL outcomes. df, degrees of freedom; IV, inverse variance; SD, standard deviation.
- Forest plots - A systematic review and metaethnography to identify how effective...Forest plots - A systematic review and metaethnography to identify how effective, cost-effective, accessible and acceptable self-management support interventions are for men with long-term conditions (SELF-MAN)
Your browsing activity is empty.
Activity recording is turned off.
See more...
