U.S. flag

An official website of the United States government

NCBI Bookshelf. A service of the National Library of Medicine, National Institutes of Health.

Guthrie B, Rogers G, Livingstone S, et al. The implications of competing risks and direct treatment disutility in cardiovascular disease and osteoporotic fracture: risk prediction and cost effectiveness analysis. Southampton (UK): National Institute for Health and Care Research; 2024 Feb. (Health and Social Care Delivery Research, No. 12.04.)
Cover of The implications of competing risks and direct treatment disutility in cardiovascular disease and osteoporotic fracture: risk prediction and cost effectiveness analysis

The implications of competing risks and direct treatment disutility in cardiovascular disease and osteoporotic fracture: risk prediction and cost effectiveness analysis.

Show details

Appendix 8Full results from cost–utility model assessing statins for the primary prevention of cardiovascular disease including adjustment for competing risk

This appendix contains cost–utility results from the statins model following the updates described in Chapter 6, General model updates, and subsequent inclusion of adjustment competing risk of non-cardiovascular death, as described in Chapter 6, New model features specific to this project.

Base case

State occupancy

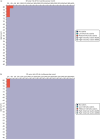
Figure 47 provides model state occupancy graphs in two untreated cohorts with and without adjustment for competing risk of non-cardiovascular mortality. Both groups comprise 60-year-olds with a 10-year QRISK3-predicted risk of 10%, but one cohort is 100% male and the other cohort is 100% female.

FIGURE 47. State occupancy (no treatment) with and without adjustment for competing risk of non-cardiovascular mortality in example cohorts.

FIGURE 47

State occupancy (no treatment) with and without adjustment for competing risk of non-cardiovascular mortality in example cohorts. (a) 60-year-old men, 10-year cardiovascular risk=10%: unadjusted for competing risk of non-cardiovascular mortality; (b) (more...)

Deterministic incremental cost–utility results

Table 56 replicates Table 97 in appendix L of CG181,10 showing estimated costs and QALYs for each statin strategy and no treatment. Table 56 also gives NHB for each arm (valuing QALYs at £20,000 each).

TABLE 56

TABLE 56

Updated model, including adjustment for competing risk of non-cardiovascular death: cost–utility results in men and women at various levels of non-cardiovascular risk

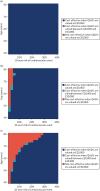
In Figures 48 and 49, we depict the cost-effectiveness of statins for people of different ages and cardiovascular risks, and how adjusting for competing risk of non-cardiovascular death affects these results. Even before adopting this adjustment, the model suggests that statins represent a good use of resources for almost everyone. It is only for people aged > 60 years with the lowest cardiovascular risk that statins represent poor value for money. However, adjusting for competing risk of non-cardiovascular death removes even this small subgroup. In practice, the distinction is moot if QRISK3 is used to predict cardiovascular risk, as it is essentially impossible for people in those age brackets to have 10-year risks low enough to enter the cost-ineffective zone. If such people did exist, then they would have extraordinary life expectancy, which is why the adjusted model concludes that it would still be good value to offer them statins, as there is every chance that even the oldest people would live to realise their benefit.
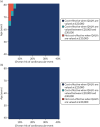
FIGURE 48. Cost-effectiveness of high-intensity statins (atorvastatin 20 mg/day) compared with no treatment, as a function of age and cardiovascular risk.

FIGURE 48

Cost-effectiveness of high-intensity statins (atorvastatin 20 mg/day) compared with no treatment, as a function of age and cardiovascular risk. (a) Unadjusted (as per CG181); and (b) adjusted for competing risk of non-cardiovascular death.

FIGURE 49. Updated CG181 model (not accounting for competing risk or DTD): relationship between age and risk of non-cardiovascular death: cost-effectiveness of statins.

FIGURE 49

Updated CG181 model (not accounting for competing risk or DTD): relationship between age and risk of non-cardiovascular death: cost-effectiveness of statins. (a) Men; and (b) women. Coloured area identifies option with highest net benefit when we value (more...)

With direct treatment disutility

We see the effect of differing DTD assumptions on the cost-effectiveness of statins across a range of ages and baseline cardiovascular event risks in Figure 50.

FIGURE 50. Cost-effectiveness of high-intensity statins (atorvastatin 20 mg/day) compared with no treatment, as a function of age, cardiovascular risk and DTD.

FIGURE 50

Cost-effectiveness of high-intensity statins (atorvastatin 20 mg/day) compared with no treatment, as a function of age, cardiovascular risk and DTD. (a) No DTD; (b) diminishing DTD; (c) time-limited DTD; and (d) permanent DTD. 50 : 50 men : women. All (more...)

Deterministic sensitivity analysis

One-way sensitivity analysis

One-way sensitivity analyses are depicted in Figures 5153.

FIGURE 51. Updated model, including adjustment for competing risk of non-cardiovascular death: one-way sensitivity analysis for high-intensity statins (atorvastatin 20 mg/day) compared with no treatment (60-year-olds, 50 : 50 men : women, 10% 10-year cardiovascular event risk).

FIGURE 51

Updated model, including adjustment for competing risk of non-cardiovascular death: one-way sensitivity analysis for high-intensity statins (atorvastatin 20 mg/day) compared with no treatment (60-year-olds, 50 : 50 men : women, 10% 10-year cardiovascular (more...)

FIGURE 53. Updated model, including adjustment for competing risk of non-cardiovascular death: one-way sensitivity analysis for medium-intensity statins (simvastatin 20 mg/day) compared with low-intensity statins (simvastatin 10 mg/day) (60-year-olds, 50 : 50 men : women, 10% 10-year cardiovascular event risk).

FIGURE 53

Updated model, including adjustment for competing risk of non-cardiovascular death: one-way sensitivity analysis for medium-intensity statins (simvastatin 20 mg/day) compared with low-intensity statins (simvastatin 10 mg/day) (60-year-olds, 50 : 50 men (more...)

FIGURE 52. Updated model, including adjustment for competing risk of non-cardiovascular death: one-way sensitivity analysis for high-intensity statins (atorvastatin 20 mg/day) compared with medium-intensity statins (simvastatin 20 mg/day) (60-year-olds, 50 : 50 men : women, 10% 10-year cardiovascular event risk).

FIGURE 52

Updated model, including adjustment for competing risk of non-cardiovascular death: one-way sensitivity analysis for high-intensity statins (atorvastatin 20 mg/day) compared with medium-intensity statins (simvastatin 20 mg/day) (60-year-olds, 50 : 50 (more...)

Probabilistic sensitivity analysis

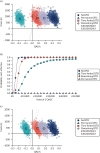
Figures 5457 illustrate the pairwise comparison between high-intensity statins (atorvastatin 20 mg/day) and no treatment with and without adjustment for competing risk of non-cardiovascular death when analysed probabilistically.

FIGURE 54. Probabilistic sensitivity analysis for high-intensity statins (atorvastatin 20 mg/day vs.

FIGURE 54

Probabilistic sensitivity analysis for high-intensity statins (atorvastatin 20 mg/day vs. no treatment) with and without adjustment for competing risk of non-cardiovascular death in example cohorts. (a) cost–utility scatterplot for 60-year-old (more...)

FIGURE 57. Updated model, including adjustment for competing risk of non-cardiovascular death: probabilistic incremental cost–utility scatterplot – high-intensity statins (atorvastatin 20 mg/day) compared with no treatment (60-year-olds, 50 : 50 men : women, 10% 10-year cardiovascular event risk).

FIGURE 57

Updated model, including adjustment for competing risk of non-cardiovascular death: probabilistic incremental cost–utility scatterplot – high-intensity statins (atorvastatin 20 mg/day) compared with no treatment (60-year-olds, 50 : 50 (more...)

FIGURE 55. Updated model, including adjustment for competing risk of non-cardiovascular death: probabilistic cost–utility scatterplot for all options (60-year-olds, 50 : 50 men : women, 10% 10-year cardiovascular event risk).

FIGURE 55

Updated model, including adjustment for competing risk of non-cardiovascular death: probabilistic cost–utility scatterplot for all options (60-year-olds, 50 : 50 men : women, 10% 10-year cardiovascular event risk).

FIGURE 56. Updated model, including adjustment for competing risk of non-cardiovascular death: cost-effectiveness acceptability curve (60-year-olds, 50 : 50 men : women, 10% 10-year cardiovascular event risk).

FIGURE 56

Updated model, including adjustment for competing risk of non-cardiovascular death: cost-effectiveness acceptability curve (60-year-olds, 50 : 50 men : women, 10% 10-year cardiovascular event risk). Bold line shows cost-effectiveness acceptability frontier. (more...)

With direct treatment disutility

In Figure 58, we show probabilistic versions of the pairwise comparison between high-intensity statins (atorvastatin 20 mg/day) and no treatment under varying DTD scenarios for a representative range of age risk profiles.

FIGURE 58. Probabilistic sensitivity analysis for high-intensity statins (atorvastatin 20 mg/day vs.

FIGURE 58

Probabilistic sensitivity analysis for high-intensity statins (atorvastatin 20 mg/day vs. no treatment) under varying DTD scenarios for example cohorts. (a) Cost–utility scatterplot for 50-year-olds, 50 : 50 men : women, 10-year cardiovascular (more...)

Scenario analysis

Pay-off time under varying direct treatment disutility assumptions

Figures 59 and 60 show cumulative incremental QALYs over time for four example profiles across our four DTD scenarios.

FIGURE 59. Payoff time for high-intensity statins (atorvastatin 20 mg/day) compared with no treatment, for different example populations under different DTD scenarios.

FIGURE 59

Payoff time for high-intensity statins (atorvastatin 20 mg/day) compared with no treatment, for different example populations under different DTD scenarios. (a) Undiscounted cumulative incremental QALYs for 50-year-olds, 50 : 50 men : women, 10-year cardiovascular (more...)

FIGURE 60. Clinical effectiveness and cost-effectiveness of high-intensity statins, as a function of age and cardiovascular risk, with different levels of DTD (as absolute decrement) and competing risk of non-cardiovascular death.

FIGURE 60

Clinical effectiveness and cost-effectiveness of high-intensity statins, as a function of age and cardiovascular risk, with different levels of DTD (as absolute decrement) and competing risk of non-cardiovascular death. (a) Effectiveness (incremental (more...)

Copyright © 2024 Guthrie et al.

This work was produced by Guthrie et al. under the terms of a commissioning contract issued by the Secretary of State for Health and Social Care. This is an Open Access publication distributed under the terms of the Creative Commons Attribution CC BY 4.0 licence, which permits unrestricted use, distribution, reproduction and adaptation in any medium and for any purpose provided that it is properly attributed. See: https://creativecommons.org/licenses/by/4.0/. For attribution the title, original author(s), the publication source – NIHR Journals Library, and the DOI of the publication must be cited.

Bookshelf ID: NBK601054

Views

  • PubReader
  • Print View
  • Cite this Page
  • PDF version of this title (9.3M)

Other titles in this collection

Recent Activity

Your browsing activity is empty.

Activity recording is turned off.

Turn recording back on

See more...