

NCBI Bookshelf. A service of the National Library of Medicine, National Institutes of Health.
Skelly AC, Chou R, Dettori JR, et al. Integrated and Comprehensive Pain Management Programs: Effectiveness and Harms [Internet]. Rockville (MD): Agency for Healthcare Research and Quality (US); 2021 Oct. (Comparative Effectiveness Review, No. 251.)
Integrated and Comprehensive Pain Management Programs: Effectiveness and Harms [Internet].
Show detailsResults of Literature Searches

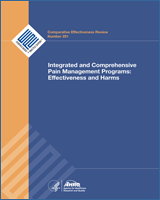
Figure B-1Literature flow diagram
a Cochrane databases include the Cochrane Central Register of Controlled Trials and the Cochrane Database of Systematic Reviews
b Studies checked for inclusion.
A total of 10,953 references were identified, 10,782 from electronic database searches and an additional 76 from handsearching and checking the bibliographies of included studies and systematic reviews, and 95 from peer review/public comment. After dual review of abstracts, 509 articles were evaluated for inclusion at the full-text level. A total of 57 randomized controlled trials (RCTs) (in 78 publications) met inclusion criteria and were included for Key Questions 1 and 2 addressing effectiveness and safety. Forty-three were rated fair quality (75%) and 14 (25%) were rated poor quality. Search results and selection of studies are summarized in the literature flow diagram above (Figure B-1). A list of included studies appears in Appendix D and excluded studies with reason for exclusion in Appendix H.
Table B-1Number of studies overall and by Key Question
| Program | Comparator |
KQ1: n=Number of RCTs (Number of Publications) |
KQ2: n=Number of RCTs (Number of Publications) |
Total: n=Number of RCTs (Number of Publications) |
|---|---|---|---|---|
| IPMP | Usual care or waitlist | 7 (10)20–29 | NA | NA |
| Provider vs. patient program | NA | 120 | NA | |
| Program with and without online support | NA | 130 | NA | |
| Any | 7 (10)20–29 | 220,30 | 8 (11)20–30 | |
| CPMP | Usual care or waitlist | 23 (30)31–60 | NA | NA |
| Physical activity | 15 (21)33,34,38,45,46,48–50,61–73 | NA | NA | |
| Psychological therapy | 5 (6)38,45,46,48,60,74 | NA | NA | |
| Pharmacologic therapy | 5 (13)75–87 | NA | NA | |
| Pharmacologic therapy plus physical activity | 2 (3)80,81,88 | NA | NA | |
| Program total hours (greater vs. fewer) | NA | 4 (7)33,34,43,62,63,89,90 | NA | |
| Program setting (inpatient vs. outpatient) | NA | 4 (6)41,42,55,58,59,70 | NA | |
| Program components (with vs. without additional psychological or physical components) | NA | 356,91,92 | NA | |
| Preintervention assessment (with vs. without) | NA | 293,94 | NA | |
| Session format (group vs. individual) | NA | 190 | NA | |
| Booster sessions (with vs. without) | NA | 172 | NA | |
| Other comparisonsa | NA | 2 (3)95,96 | NA | |
| Any | 41 (58)31–55,57–88 | 16 (22)33,34,41–43,55,56,58,59,62,63,70,72,89–97 | 49 (67)31–97 | |
| IPMP and CPMP | Any | 48 (68)20–29,31–55,57–88 | 18 (24)20,30,33,34,41–43,55,56,58,59,62,63,70,72,89–97 | 57 (78)20–97 |
- a
Comparisons included a function-centered vs. a pain-centered approach to CPMP in one trial and an “exposure in vivo” approach vs. a graded activity approach to CPMP in the other trial.
Description of Included Studies
Tables B-2 and B-3 below provide an overview of the trial and population characteristics for RCTs that address Key Questions 1 (effectiveness and safety) and 2 (program factors), respectively. Data for trials evaluating integrated pain management programs (IPMPs) and comprehensive pain management programs (CPMPs) are presented separately. Weighted mean or proportions are presented for all IPMP or CPMP trials and then for these programs versus each specific comparator.
Table B-2Study and population characteristics for trials addressing KQ1 by type of program and comparator
| Weighted Means or Proportionsa |
All Comparisons |
Vs. UC/WL |
All Comparisons |
Vs. UC/WL |
Vs. PA Alone |
Vs. Psychological Therapy Alone |
Vs. Pharmacologic Therapy Alone |
Vs. PA + Pharmacologic Therapy | |
|---|---|---|---|---|---|---|---|---|---|
| N population | 2484 | 2263 | 397 | 5823 | 2706 | 2363 | 531 | 311 | 116 |
| # of unique RCTs | 7 | 7 | 1 | 41 | 23 | 15 | 5 | 5 | 2 |
| # publications | 10 | 10 | 2 | 58 | 30 | 21 | 6 | 13 | 3 |
| # RCTs conducted in United States | 4 | 4 | 0 | 3 | 3 | 1 | 1 | 0 | 0 |
| Mean age (years) (n trials) b | 56.7 (6) | 56.8 (6) | 63.4 | 45.4 (35) | 45.8 (19) | 43.8 (11) | 45.5 (4) | 47.0 (4) | 47.3 (1) |
| % Male (n trials) | 48% (7) | 50% (7) | 27% | 40% (40) | 36% (21) | 47% (14) | 38% (4) | 29% (4) | 0% (1) |
| % Disabled (n trials) | 33% (6) | 36% (6) | 6% | 57% (19) | 71% (6) | 66% (7) | 62% (3) | 10% (2) | 23% (1) |
| % Nonwhite (n trials) | 31% (4) | 31% (4) | 43% | 6% (8) | 7% (5) | NR (0) | NR (0) | 2% (1) | NR (0) |
| Mean pain/disease duration, months (n trials) | 153 (3) | 153 (3) | NR (0) | 110 (23) | 123 (14) | 46 (6) | 95 (5) | 102 (4) | 196 (1) |
| Mean baseline pain score (0-10) (n trials) | 5.3 (4) | 5.3 (4) | NR (0) | 5.5 (25) | 4.9 (13) | 4.4 (7) | 5.4 (3) | 6.6 (3) | 4.5 (2) |
| % LBP | 30% | 33% | 0% | 52% | 38% | 69% | 25% | 57% | 47% |
| % OA, RA | 34% | 37% | 100% | 7% | 16% | 0% | 0% | 0% | 0% |
| % FM, CWP | 18% | 10% | 0% | 16% | 21% | 7% | 0% | 43% | 53% |
| % Neck, shoulder pain | 0% | 0% | 0% | 0% | 0% | 0% | 0% | 0% | 0% |
| % Mixed/multiple pain conditions | 19% | 21% | 0% | 22% | 20% | 22% | 75% | 0% | 0% |
| % Other | 0% | 0% | 0% | 3% | 7% | 18% | 0% | 0% | 0% |
| % Depression diagnosis (n trials) | 18% (1) | 18% (1) | 0% | 20% (7) | 20% (6) | 18% (3) | 11% (1) | NR (0) | NR (0) |
| % Anxiety diagnosis (n trials) | 13% (1) | 13% (1) | 0% | 32% (4) | 35% (5) | 22% (1) | 22% (1) | NR (0) | NR (0) |
| % PTSD diagnosis (n trials) | 17% (1) | 17% (1) | 0% | NR (0) | NR (0) | NR (0) | NR (0) | NR (0) | NR (0) |
| % Overweight, obese (n trials) | 56% (1) | 56% (1) | 0% | 77% (1) | NR (0) | NR (0) | NR (0) | NR (0) | NR (0) |
| % SUD (n trials) | NR (0) | NR (0) | NR (0) | NR (0) | NR (0) | 9% (1) | 14% (1) | NR (0) | NR (0) |
| % Suicidal ideation (n trials) | NR (0) | NR (0) | NR (0) | 5% (2) | 9% (3) | NR (0) | NR (0) | 0% (1) | 0% (1) |
| % Smoking (n trials) | NR | NR | NR | 34% (8) | 41% (3) | 45% (3) | NR | 5% (2) | NR (0) |
| # Fair-quality RCTs (% of total) | 6 (86%) | 6 (86%) | 1 (100%) | 29 (71%) | 15 (65%) | 13 (87%) | 3 (60%) | 3 (60%) | 1 (50%) |
| # Poor-quality RCTs (% of total) | 1 (14%) | 1 (14%) | NA | 12 (29%) | 8 (35%) | 2 (13%) | 2 (40%) | 2 (40%) | 1 (50%) |
CPMP = comprehensive pain management program; CWP = chronic widespread pain; FM = fibromyalgia; IPMP = Integrated Pain Management Programs; LBP = low back pain; NA = not applicable; NR = Not reported; OA = osteoarthritis; PTSD = post-traumatic stress disorder; RA = rheumatoid arthritis; SUD = substance use disorder
- a
Some trials did not report the baseline demographic/characteristics listed. The weighted mean or proportion was calculated from the number of trials (i.e., n trials) that did report that variable
- b
Data are for one trial with three arms
Table B-3Study and population characteristics for trials addressing KQ2 by type of program and comparator
| Weighted Means or Proportionsa | IPMP |
Higher Vs. Lower Hours |
IP Vs. OP Setting |
Addition of Components |
Preintervention Assessment |
Philosophical Approaches |
Booster Sessions |
Group Vs. Individualb |
|---|---|---|---|---|---|---|---|---|
| N population | 517 | 328 | 551 | 158 | 429 | 259 | 232 | 50 |
| # of RCTs | 2 | 4 | 4 | 3 | 2 | 2 | 1 | 1 |
| # publications | 2 | 7 | 6 | 3 | 2 | 3 | 1 | 1 |
| # RCTs conducted in United States | 1 | 0 | 0 | 1 | 0 | 0 | 0 | 0 |
| Mean age (years) (n trials) | 58.8 (2) | 42.2 (2) | 45.9 (2) | 41.4 (2) | 46.0 (1) | 43.0 (2) | 48.9 | 42.0 |
| % Male (n trials) | 32% (2) | 42% (2) | 57% (4) | 18% (2) | 54% (2) | 70% | 23% | 41% |
| % Disabled (n trials) | 85 (1) | 58% (2) | 64% (1) | 100% (1) | 81% (1) | 54% (1) | NR | NR |
| % Non-White (n trials) | 40% (1) | NR (0) | 12% (2) | NR (0) | NR | NR (0) | NR | NR |
| Mean pain or disease duration, months (n trials) | 115 (2) | 90 (1) | 155 (2) | 74 (1) | NR (0) | 108 (1) | NR (0) | NR (0) |
| Mean pain score at baseline (0-10) (n trials) | 4.7 (2) | 5.9 (3) | 6.0 (3) | 4.6 (2) | 7.2 (1) | 5.5 (2) | NR (0) | NR (0) |
| % LBP | 0% | 41% | 75% | 41% | 0% | 100% | 0% | 100% |
| % OA, RA | 0% | 0% | 0% | 0% | 0% | 0% | 0% | 0% |
| % FM, CWP | 0% | 12% | 0% | 0% | 0% | 0% | 0% | 0% |
| % Neck, shoulder pain | 0% | 0% | 0% | 0% | 0% | 0% | 0% | 0% |
| % Mixed/multiple pain conditions | 100% | 47% | 25% | 59% | 100% | 0% | 0% | 0% |
| % Other | 0% | 0% | 0% | 0% | 0% | 0% | 100%c | 0% |
| % Depression diagnosis (n trials) | NR | NR | NR | NR | NR | NR | NR | NR |
| % Anxiety diagnosis (n trials) | NR | NR | NR | NR | NR | NR | NR | NR |
| % PTSD diagnosis (n trials) | NR | NR | NR | NR | NR | NR | NR | NR |
| % Overweight, obese (n trials) | NR | NR | NR | NR | NR | NR | NR | NR |
| % SUD (n trials) | NR | NR | NR | NR | NR | NR | NR | NR |
| % Suicidal ideation (n trials) | NR | NR | NR | NR | NR | NR | NR | NR |
| % Smoking | NR | NR | NR | NR | NR | NR | NR | NR |
| # Fair-quality RCTs (% of total) | 2 (100%) | 3 (75%) | 0 | 2 (67%) | 2 (100%) | 2 (100%) | 1 (100%) | 0 |
| # Poor-quality RCTs (% of total) | 0 | 1 (25%) | 4 (100%) | 1 (33%) | 0 | 0 | 0 | 1 (100%) |
- a
Some trials did not report the baseline demographic/characteristics listed. The weighted mean or proportion was calculated from the number of trials (i.e., n trials) that did report that variable
- b
Population demographics for this study include patients not included in this comparison; authors reported demographics for the population as a whole.
- c
All patients included in this study had chronic back pain (at any location).
Summary Results Tables
Table B-4Summary results for trials addressing KQ1: IPMPs versus usual care, versus physical activity, and versus psychological therapy
|
Author, Year Country Pain Duration Study Design Study Quality | Intervention and Comparator (n): Duration/Intensity, Session Format, Setting | Population |
Primary Outcomes: Pain, Function, and Opioid Use |
Secondary Outcomes: HRQOL, Psychological Measures, Global Improvement, Patient Satisfaction | Harms Utilization |
|---|---|---|---|---|---|
|
Allen, 2016 USA Mean duration of pain: 170 months Cluster RCT Fair |
A. Patient focused multidisciplinary treatment + provider focused multidisciplinary treatment + usual care (n=151 patients, 15 providers): 12 months (time duration NR), individual, Community-based outpatient clinics B. Usual care (n=149 patients, 15 providers) |
Patient Participants Mean age: 61 years Male: 91% Non-White race: 50% Pain etiology/type: Arthritis Joints with OA:
Fair or poor health: 38% Mean BMI: 33.8 kg/m2 Provider Participants Mean study patients per provider: 10.0 <15% females in patient panel: 83% Male: 40% Provider Type:
|
A vs. B, mean (SD) WOMAC Pain Subscale (0-10) Baseline: 5.1 (NR) (not reported by group) Postintervention: 4.7 (NR) vs. 4.95 (NR), difference −0.25 (95% CI −0.6 to 0.1) Estimated percentage improving ≥18% on WOMAC score from baseline (8.7 point reduction) Postintervention: 36.1% (NR) vs. 28.2% (NR); OR 1.3 (95% CI, 0.9 to 1.8) WOMAC Total (0-96) Baseline: 48.9 (17.6) vs. 47.8 (17.4) Postintervention: 44.4 (NR) vs. 48.5 (NR), difference −4.1 (95% CI −7.2 to −1.1) WOMAC Function Subscale (0-68) Baseline: 33.8 (NR) (not report by group) Postintervention: 31.0 (NR) vs. 34.3 (NR), difference −3.3 (95% CI −5.7 to −1.0) SPPB (Physical Function) (0-12) Baseline: 8.0 (2.6) vs. 8.1 (2.5) Postintervention: 7.8 (NR) vs. 7.6 (NR), difference 0.3 (95% CI −0.3 to 0.9) |
A vs. B, mean (SD) PHQ-8 (0-24) Baseline: 7.2 (5.6) vs. 6.4 (5.1) Postintervention: 6.2 (NR) vs. 6.8 (NR), difference −0.6 (95% CI −1.5 to 0.3) |
A vs. B, % (n/N) Adverse Events 4 study-related adverse events occurred, but none were associated with the OA intervention. Provider Referrals Orthopedic visit:
|
|
Allen, 2017 USA Mean duration of symptoms: 124.8 months Cluster RCT Fair |
A. Patient focused multidisciplinary treatment + provider focused multidisciplinary treatment + usual care (n=140 patients, 5 providers): 12 months (time duration NR), individual, Community-based outpatient clinics B. Provider focused multidisciplinary treatment + usual care (n=140 patients, 5 providers): 12 months C. Patient focused multidisciplinary treatment + usual care (n=128 patients, 5 providers): 12 months D. Usual care (n=129 patients, 5 providers) |
Patient Participants Mean age: 63.3 years Male: 26% Non-White race: 40% Joints with OA:
Fair or poor health: 20% Mean BMI: 35.6 kg/m2 Clinic and Provider Characteristics Mean providers: 7.3 Mean medical physicians and osteopaths: 6.2 Mean nurse practitioners and physician assistants: 1.1 Family medicine practice: 60% Internal medicine practice: 40% Providers:
|
A vs. B vs. C vs. D, difference in change scores (95% CI) from baseline to follow-up WOMAC Pain Subscale (0-10) Baseline: 4.2 (NR) vs. 4.0 (NR) vs. 4.4 (NR) vs. 3.8 NR) Postintervention: difference in change scores from baseline for A vs. D: −0.15 (–0.65 to 0.3) B vs. D: 0.15 (–0.35 to 0.6) C vs. D: −0.2 (–0.7 to 0.25) Estimated percentage (95% CI) improving ≥18% on WOMAC score from baseline (8.7 point reduction) Postintervention: 44% (35% to 56%) vs. 35% (28% to 44%) vs. 49% (37% to 63%) vs. 49% (42% to 57%) Only group B (provider) differed from group D (usual care): OR 0.7 (95% CI, 0.4 to 0.9), p = 0.016 WOMAC Total (0-96) Baseline: 40.1 (15.8) vs. 37.7 (17.9) vs. 41.0 (15.9) vs. 35.6 (18.0) Postintervention: difference in change scores from baseline for A vs. D: −0.7 (–4.2 to 2.8) B vs. D: 2.5 (–0.9 to 5.9) C vs. D: −1.5 (–5.1 to 2.0) WOMAC Function Subscale (0-68) Baseline: 27.5 (NR) vs. 26.0 (NR) vs. 28.5 (NR) vs. 24.7 Postintervention: difference in change scores from baseline for A vs. D: −0.2 (–2.7 to 2.3) B vs. D: 2.3 (–0.1 to 4.7) C vs. D: −1.0 (–3.5 to 1.6) SPPB (Physical Function) Baseline: 8.5 (NR) vs. 8.8 (NR) vs. 8.3 (NR) vs. 8.5 (NR) Postintervention: difference in change scores from baseline for A vs. D: −0.3 (–0.8 to 0.3) B vs. D: −0.4 (–1.0 to 0.1) C vs. D: −0.3 (–0.8 to 0.3) |
A vs. B vs. C vs. D, difference in change scores (95% CI) from baseline to follow-up PHQ-8 score (0-24) Baseline (mean, SD): 4.9 (NR) vs. 4.5 (NR) vs. 4.8 (NR) vs. 4.0 (NR) Postintervention: difference in change scores from baseline for A vs. D: 0.1 (–0.8 to 1.0) B vs. D: 0.6 (–0.2 to 1.5) C vs. D: 0.3 (–0.6 to 1.2) |
A vs. B vs. C vs. D, % (n/N) Harms No study-related adverse events occurred Joint Injection:
New pain medication (medication not specified):
Orthopedic Visit:
|
|
Angeles, 2013 Canada Mean duration of pain: NR Poor |
A. IPMP (n=29) 2 months (2 hour group sessions 1 time per week) (16 hours total), group, Outpatient clinics B. Waitlist (n=34): |
40 to 59 years of age: 51% (mean age NR) Male: 27% Race/ethnicity: NR Pain etiology/type: chronic MSK or neuropathic pain
|
A vs. B, % (n/N) Early opioid prescription refill: Intermediate term: 7.7% (1/19) vs. 25% (6/22), p=0.08; RR 0.19 (95% CI 0.03 to 1.46) Increase in opioid medication dose: Intermediate term: 11.5% (2/19) vs. 9.4% (2/22), p=0.56; RR 1.16 (95% CI 0.18 to 7.45) |
Baseline: NR Postintervention: change from baseline −2.9 vs. −3.0, p=0.98 Baseline: NR Postintervention: change from baseline 3.6 vs. 3.6, p=1.00 |
Harms No study-related adverse events occurred. |
|
Dobscha, 2008/2009 & Dickinson, 2010 USA Mean duration of pain: 178 months Cluster RCT Fair |
A. IPMP – provider assistance with pain treatment and use of stepped care (n=214): 12 months (time duration NR), mode of delivery NR, 3 urban and 2 rural outpatient clinics B. Usual care (n=187) |
Mean age: 62 years Male: 92% Race/Ethnicity
|
A vs. B, Mean (95% CI) Chronic Pain Grade Severity/Intensity subscale (0–100) a Baseline: 67.4 (65.4 to 69.3) vs. 66.0 (64.3 to 67.8) Postintervention: : 63.2 (60.7 to 65.7) vs. 65.6 (63.3 to 67.9), difference −2.4 (95% CI −7.03 to 2.23) Proportion of patients demonstrating a ≥30% reduction in RMDQ score Postintervention: 21.9% (41/187) vs. 14.0% (30/214); RR 1.56 (95% CI 1.02 to 2.40) Baseline: 14.6 (14.3 to 14.9) vs. 14.5 (14.0 to 15.0) Postintervention: 13.3 (12.9 to 13.7) vs. 14.3 (13.6 to 15.0), difference −1.0 (95% CI −1.69 to −0.31) Chronic Pain Grade Disability/Interference subscale (0–100) a Baseline: 49.3 (45.9 to 52.8) vs. 48.7 (45.5 to 51.9) Postintervention: 44.6 (40.7 to 48.4) vs. 51.1 (47.6 to 54.6), difference −6.5 (95% CI −11.74 to −1.26) Pain disability-free days, Mean (SD) Baseline to postintervention: 141.8 (108.3) vs. 124.1 (107.5), difference 17.7 (95% CI −3.54 to 38.94) Medication prescriptions for a 52-week period, % (n/N) c Any opioid prescribed: 65% (120/185) vs. 61% (129/212)
|
A vs. B, Mean (95% CI) EQ-5D (0-1) a Baseline: 0.65 (0.63 to 0.68) vs. 0.64 (0.62 to 0.67) Postintervention: 0.64 (0.61 to 0.67) vs. 0.60 (0.57 to 0.63), difference 0.04 (95% CI – 0.002 to 0.08) PHQ-9 (0-27) b Baseline: 14.4 (13.4 to 15.5) vs. 14.4 (13.5 to 15.3) Postintervention: 10.6 (9.1 to 12.1) vs. 13.2 (11.9 to 14.5), difference −2.6 (95% CI −4.61 to 0.59) Global treatment satisfaction (scale NR) a Baseline: 2.9 (2.8 to 3.0) vs. 2.9 (2.8 to 3.1) Postintervention: 2.7 (2.5 to 2.8) vs. 2.6 (2.4 to 2.7), difference 0.1 (95% CI −0.11 to 0.31) Global impression of change in past 6 months (0-7) Postintervention: 3.7 (3.5 to 3.8) vs. 4.4 (4.3 to 4.6), difference −0.7 (95% CI −0.93 to −0.47) |
A vs. B, Mean (SD) or % (n/N) Harms No study-related adverse events occurred. Healthcare Utilization
|
|
Mas, 2019 Spain Mean duration of pain: 0.5 to 3 months Cluster RCT Fair |
A. IPMP (n=262; 26 primary healthcare centers): one 10 hour session (4 hours physical therapy, 4 hours psychology, 2 hours for questions with general practitioner (10 hours total), combined group and individual, outpatient clinic B. Usual Care (n=239; 13 primary healthcare centers) |
Mean age: 47 years Male: 35% Race/Ethnicity: NR Pain etiology/type: Subacute low back pain Disability: NR Comorbidities:
|
Baseline: 5.8 (2.3) vs. 5.9 (2.3) Short term: 3.2 (3.2) vs. 4.1 (3.3), adjusted difference −0.77 (95% CI −1.53 to −0.01) Long term (12 months): 3.6 (3.0) vs. 3.9 (3.2), adjusted difference −0.27 (95% CI – 0.88 to 0.34) MPQ Total Intensity Score (0–14) d Baseline: 6.7 (3.1) vs. 6.5 (3.1) Short term: 4.0 (3.6) vs. 4.6 (3.6), adjusted difference −0.49 (–1.39 to 0.42) Long term (12 months): 3.1 (3.2) vs. 3.6 (3.6), adjusted difference 0.69 (–1.41 to 0.02) MPQ Current Intensity Score (0-5) Baseline: 2.6 (1.1) vs. 2.5 (1.2) Short term: 1.7 (1.5) vs. 1.3 (1.4), adjusted difference −0.32 (95% CI −0.63 to −0.02) Long term (12 months): 1.6 (1.4) vs. 1.4 (1.3), adjusted difference −0.18 (95% CI – 0.43 to 0.08) RMDQ (0-24) Baseline: 10.0 (5.2) vs. 9.9 (5.3) Short term: 6.2 (4.9) vs. 7.4 (5.5), adjusted difference −1.33 (95% CI −2.22 to −0.45) Long term (12 months): 5.1 (4.9) vs. 6.0 (5.7), adjusted difference −1.11 (95% CI – 2.08 to −0.13) |
A vs. B, Mean (SD) SF-12 Physical health (0-100) Baseline: 41.9 (9.0) vs. 40.7 (9.3) Short term: 46.5 (8.7) vs. 45.3 (9.8), adjusted difference 0.55 (95% CI −1.19 to 2.29) Long term (12 months): 47.0 (8.9) vs. 46.2 (9.5), adjusted difference 0.53 (95% CI −1.20 to 2.27) SF-12 Mental health (0-100) Baseline: 43.4 (12.8) vs. 42.3 (12.4) Short term: 48.8 (12.0) vs. 45.0 (13.2), adjusted difference 2.56 (95% CI −0.33 to 5.45) Long term (12 months): 48.9 (11.2) vs. 47.0 (11.9), adjusted difference 1.48 (95% CI −0.86 to 3.83) | NR |
|
McBeth 2012 & Beasley, 2015 England Mean duration of pain: NR Fair |
A. IPMP with telephone delivered CBT and exercise (n=112): 6 months, initial assessment (0.75 to 1 hour) seven weekly sessions for 6 weeks (0.5 to 0.75 hours per session, 3.5 to 5.25 hours each week, 21 to 31.5 hours over 6 weeks), and a single 0.5- to 0.75-hour session at 3 and 6 months (0.5 to 1.5 hours) (21.25 to 34.75 hours total), individual, patient home and local gym B. Usual Care (n=109) C. Telephone-delivered CBT alone (n=112) D. Exercise alone (n=109) |
Mean age: 56 years Male: 31% Race/Ethnicity: NR Pain etiology/type: Chronic widespread pain Disability: NR Comorbidities:
|
% (n/N) Chronic Pain Grade questionnaire A vs. B Baseline:
Short term:
Long term (24 months):
A vs. C Baseline:
Short term:
Long term (24 months):
A vs. D Baseline:
Short term:
Long term (24 months):
|
Mean (SD) A vs. B Baseline: 38.1 (8.0) vs. 37.4 (8.2) Postintervention: 43.0 (9.2) vs. 39.9 (10.1), difference 3.1 (95% CI 0.54 to 5.66) Short term: 42.8 (9.9) vs. 39.6 (10.5), difference 3.2 (95% CI 0.49 to 5.91) Long term (24 months): NR A vs. C Baseline: 38.1 (8.0) vs. 38.9 (8.4) Postintervention: 43.0 (9.2) vs. 41.5 (11.0), difference 1.5 (95% CI −1.17 to 4.17) Short term: 42.8 (9.9) vs. 40.8 (11.2), difference 2.0 (95% CI −0.78 to 4.78) Long term (24 months): NR A vs. D Baseline: 38.1 (8.0) vs. 37.8 (7.5) Postintervention: 43.0 (9.2) vs. 40.2 (10.1), difference 2.8 (95% CI 0.24 to 5.36) Short term: 42.8 (9.9) vs. 41.9 (9.1), difference 0.9 (95% CI −1.62 to 3.42) Long term (24 months): NR A vs. B Baseline: 43.9 (10.0) vs. 42.5 (10.6)Postintervention: 46.0 (10.9) vs. 43.4 (10.2), difference: 2.6 (95% CI −0.20 to 5.4) Short term: 45.5 (10.6) vs. 43.4 (11.0), difference 2.1 (95% CI −0.76 to 4.96) Long term (24 months): NR A vs. C Baseline: 43.9 (10.0) vs. 43.6 (10.9) Postintervention: 46.0 (10.9)vs. 46.3 (9.9), difference −0.3 (95% CI −3.04 to 2.44) Short term: 45.5 (10.6) vs. 47.0 (10.2), difference −1.5 (95% CI −4.24 to 1.24) Long term (24 months): NR A vs. D Baseline: 43.9 (10.0) vs. 43.5 (10.1) Postintervention: 46.0 (10.9) vs. 46.7 (10.8), difference −0.7 (95% CI −3.58 to 2.18) Short term: 45.5 (10.6) vs. 45.8 (9.7), difference −0.3 (95% CI −2.99 to 2.40) Long term (24 months): NR GHQ (0-12) A vs. B Baseline: 3.1 (3.5) vs. 3.4 (3.5) Postintervention: 1.7 (2.8) vs. 2.8 (3.5), difference −1.1 (95% CI −1.94 to −0.26) Short term: 2.0 (3.4) vs. 3.0 (3.8), difference −1.0 (95% CI −1.96 to −0.05) Long term (24 months): 3.0 (3.7) vs. 3.0 (3.3), difference 0.0 (95% CI −0.93 to 0.93) A vs. C Baseline: 3.1 (3.5) vs. 3.3 (3.6) Postintervention: 1.7 (2.8) vs. 1.7 (2.9), difference: 0.0 (95% CI −0.75 to 0.75) Short term: 2.0 (3.4) vs. 2.0 (3.6), difference 0.0 (95% CI −0.92 to 0.92) Long term (24 months): 3.0 (3.7) vs. 2.2 (3.4), difference 0.8 (–0.14 to 1.74) A vs. D Baseline: 3.1 (3.5) vs. 3.2 (3.6) Postintervention: 1.7 (2.8) vs. 1.8 (2.8), difference −0.1 (95% CI −0.84 to 0.64) Short term: 2.0 (3.4) vs. 2.0 (3.0), difference 0.0 (95% CI −0.85 to 0.85) Long term (24 months): 3.0 (3.7) vs. 2.6 (3.7), difference 0.4 (95% CI −0.581 to 1.38) EQ-5D (0-1) Long term (24 months): A vs. B 0.68 (0.24) vs. 0.63 (0.32), difference 0.05 (95% CI −0.02 to 0.13) A vs. C 0.68 (0.24) vs. 0.73 (0.24), difference −0.05 (95% CI – 0.11 to 0.01) A vs. D 0/68 (0.24) vs. 0.71 (0.24), difference −0.03 (95% CI −0.09 to 0.03) Clinical global impression change score (0-7, higher=greater feeling of change in health status; Much better or very much better = scores of 6 and 7; Less than much better = scores <6 A vs. B Postintervention:
Postintervention:
Postintervention:
|
Harms Two deaths due to cancer were recorded: (1 in the exercise group and 1 in the TCBT group). None of the adverse events were due to the interventions. |
|
Von Korff, 2005 USA Mean duration of pain: NR USA Fair |
A. IPMP (n=119 randomized): 4 sessions over ~1 month, one 1.5 hour psychology session during first visit, then one 1 hour physical therapy session 1 to 1.5 weeks later, followed by a 0.5 hour psychology session 2 weeks later, and then a 0.5 hour physical therapy session 1.5 weeks later (3.5 hours total), individual, outpatient B. Usual Care (n=121 randomized): NR |
Mean age: 50 years Male: 38% Race/Ethnicity:
Disability:
|
A vs. B, Mean (SD) Pain NRS (0-10) Baseline: 5.7 (1.8) vs. 5.8 (1.8) Postintervention: 4.9 (2.0) vs. 5.3 (1.9), difference: −0.4 (95% CI −0.90 to 0.10) Short term: 4.2 (2.0) vs. 4.7 (2.2), difference: −0.5 (95% CI −1.04 to 0.04) Intermediate term: 4.0 (2.3) vs. 4.7 (2.1), difference: −0.7 (95% CI −1.26 to −0.14) Long term (24 months): 4.3 (2.1) vs. 4.6 (2.5), difference: −0.3 (95% CI −0.89 to 0.29) RMDQ (0-23) Baseline: 12.3 (5.5) vs. 11.4 (5.7) Postintervention: 10.2 (6.3) vs. 11.5 (5.8), difference: −1.3 (95% CI −2.84 to 0.24) Short term: 9.2 (6.6) vs. 10.1 (6.4), difference: −0.9 (95% CI −2.55 to 0.75) Intermediate term: 8.4 (7.0) vs. 9.1 (6.3), difference: −0.7 (95% CI −2.39 to 0.99) Long term (24 months): 8.1 (6.5) vs. 9.1 (7.2), difference: −1.0 (95% CI −2.75 to 0.75) A vs. B, % (n/N) Proportion of patients with greater than a one-third reduction in RMDQ score Postintervention: 27.7% (28/101) vs. 13.2% (14/106), adjusted OR 3.9, p=0.0007 Short term: 42.2% (43/101) vs. 23.7% (25/106), adjusted OR 3.5, p=0.0005 Intermediate term: 44.6% (45/101) vs. 22.7% (24/106), adjusted OR 2.1, p=0.03 Long term (24 months): 49.4% (50/101) vs. 37.0% (39/106), adjusted OR 1.8, p=0.08 |
A vs. B, Mean (SD) SF-36 Social functioning subscale (0-100) Baseline 66.7 (26.7) vs. 70.4 (27.0) Postintervention: NR Short term: 74.4 (27.1) vs. 73.6 (27.8), difference: 0.8 (95% CI −6.18 to 7.78) Intermediate term: 75.8 (28.3) vs. 74.4 (24.0), difference: 1.4 (95% CI −5.27 to 8.07) Long term (24 months): 76.7 (25.2) vs. 76.3 (25.8), difference: 0.4 (95% CI −6.09 to 6.89) Baseline 67.0 (18.3) vs. 68.9 (16.9) Postintervention: NR Short term: 70.3 (19.9) vs. 69.5 (19.1), difference: 0.8 (95% CI −4.16 to 5.76) Intermediate term: 70.9 (19.9) vs. 71.1 (18.4), difference: −0.2 (95% CI −5.09 to 4.67) Long term (24 months): 71.0 (18.2) vs. 72.4 (18.3), difference: −1.4 (95% CI −6.04 to 3.24) |
A vs. B, % (n/N) Proportion receiving workers compensation or disability payments for back pain Baseline: 4.4% vs. 3.3%, p=NR Postintervention: 1.8% vs. 4.2%, p=0.04 Short term: 4.6% vs. 4.6%, p=0.45 Intermediate term): 7.1% vs. 3.1%, p=0.53 Long term (24 months): 6.4% vs. 5.4%, p=0.67 Adverse Events No study-related adverse events occurred. |
BMI = Body mass index; CI = confidence interval; EQ5D = EuroQoL 5 dimensions; GHQ = General Health Questionnaire; HRQOL = Health-related quality of life; MCS = Mental Component Score; MPQ = McGill Pain Questionnaire; NR = not reported; NRS = numerical rating scale; OA = osteoarthritis; OMPSQ = Orebro Musculoskeletal Pain Screening Questionnaire; OR = odds ratio; PCS = Physical Component Score; PDI = Pain Disability Index; PHQ-8 or -9 = Patient Health Questionnaire 8 or 9 questions; RCT = randomized controlled trial; RMDQ = Roland Morris Disability Questionnaire; RR = risk ratio; SD = standard deviation; SF-12 = Short-Form 12; SF-36 = Short-Form 36 questionnaire; SPPB = Short Physical Performance battery; USA = United States of America; VAS = visual analog scale; WOMAC = Western Ontario and McMaster Universities Osteoarthritis Index
- a
Adjusted for age, sex, PHQ-9 score at baseline, RxRisk-V medical morbidity score, and opioid prescription at any point from 6 months before, up to, and including enrollment date.
- b
Adjusted for age, sex RxRisk-V medical morbidity, and opioid prescription withing 6 months prior to the enrollment date.
- c
Adjusted for age, sex Patient Health Questionnaire 9 score at baseline, RxRisk-V medical morbidity, and baseline opioid prescription status.
- d
Adjusted for age, gender, baseline outcome measurement, and the significant confounder and significant interaction variables.
Table B-5Summary results for trials addressing KQ1: CPMPs versus usual care or waitlist control
|
Author, Year Country Pain Duration Study Design Study Quality | Intervention and Comparator (n), Duration/Intensity, Session Format, Setting | Population | Primary Outcomes: Pain, Function, and Opioid Use | Secondary Outcomes: HRQOL, Psychological Measures, Global Improvement | Harms, Utilization, Patient Satisfaction |
|---|---|---|---|---|---|
|
Abbasi, 2012 Iran Duration of pain: 74 months Poor |
A. Comprehensive, pain management program, spouse assisted group (n=9): 1 day a week for 7 weeks, (2-hour sessions, 14 hours total) group sessions; outpatient B. Comprehensive pain management program, conventional group (n=10): 1 day a week for 7 weeks, (2-hour sessions, 14 hours total) group sessions; outpatient C. Usual care (n=10) |
Mean age: 45 years Male: 12% Race/Ethnicity: NR Median duration of pain: 74 months Pain etiology/type: Chronic LBP Disability: NR Comorbidities:
|
A vs. B vs. C, Mean (SD) VAS pain in last week (0-10) A vs. C Baseline: 5 (2.7) vs. 3.6 (1.7) Postintervention: 3 (1.8) vs. 3.2 (1.6), difference −0.20 (95% CI −1.80 to 1.40) Long term: 2.8 (2.7) vs. 4.3 (1.4); difference −1.50 (95% CI −3.55 to 0.55) B vs. C Baseline: 4.6 (2) vs. 3.6 (1.7) Postintervention: 2.6 (2) vs. 3.2 (1.6); difference −0.60 (95% CI −2.18 to 0.98) Long term: 3.7 (2.5) vs. 4.3 (1.4); difference −0.60 (95% CI −2.50 to 1.30) RMDQ (0-24) A vs. C Baseline: 11.2 (4.3) vs. 8.4 (3.3) Postintervention: 5.8 (3) vs. 3.2 (3.2); difference 2.60 (95% CI −0.34 to 5.54) Long term: 8.2 (5.4) vs. 10.4 (6.2); difference −2.20 (95% CI −7.86 to 3.46) B vs. C Baseline: 12.1 (5.7) vs. 8.4 (3.3) Postintervention: 6.2 (4.4) vs. 3.2 (3.2); difference 3.00 (95% CI −0.36 to 6.36) Long term: 8.8 (5.9) vs. 10.4 (6.2); difference −1.60 (95% CI −7.29 to 4.09) | NR | NR |
|
Ahlmen 1988 Sweden Duration of pain: 11 years (≥10 years: 38%) Fair |
A. Comprehensive pain management program, Long-term (n=31): Duration of treatment: 12 months, 2 hours a week (14 hours total), individual + group sessions, outpatient B. Usual care (n=28) |
Mean age: 59 years Female: 100% Race/Ethnicity: NR Pain etiology/type: Rheumatoid arthritis Disability: NR Comorbidities: NR |
A vs. B, Mean (SD) SIP Overall Score (0-100) Baseline: 22.1 (11.8) vs. 19.8 (11.0) Postintervention change score −3.6 (6.2) vs. −0.1 (5.3), p<0.05 SIP, Physical Index (scale NR) Baseline: 22.7 (15.8) vs. 19.8 (13.1) Postintervention change score: −4.6 (7.7) vs. 0.3 (5.5), p<0.01 SIP, Psychosocial Index (scale NR) Baseline: 11.1 (7.8) vs. 11.2 (11.6) Postintervention change score: −3.3 (7.1) vs. −0.7 (6.7), p=NS |
A vs. B, Mean (SD) MACL (scale NR) Baseline: 3.28 (0.33) vs. 3.16 (0.46) Postintervention: 3.29 (0.31) vs. 3.15 (0.44), p=NS |
A vs. B, Mean (SD) Utilization: No between group differences in the following (data NR):
|
|
Amris 2014 (IMPROvE trial) Denmark Duration of pain: median 126 months Fair |
A. Comprehensive pain management program (n=96): 2 weeks, (3 to 5 hours sessions, 35 hours total) group sessions; outpatient B. Waitlist control (n=95) |
Mean age: 44 Female: 100% Race/Ethnicity: NR Pain etiology/type: Fibromyalgia Disability:
|
A vs. B Mean (95% CI) change scores from baseline Baseline (mean, SD): mean 7.1 (2.0) vs 7.4 (1.7) Short term: 0.07 (–0.31 to 0.44) vs. −0.14 (–0.52, 0.27), difference in change scores 0.21 (95% CI −0.32 to 0.74) FIQ Total (0-100) Baseline (mean, SD): 64.0 (15.8) vs 65.7 (13.0) Short term: −1.28 (–3.90 to 1.33) vs. −1.37 (–4.01 to 1.28), difference in change scores 0.08 (95% CI −3.64 to 3.80) |
A vs. B % (n/N) or Mean (95% CI) change scores from baseline Proportion of patients considered to be responders on the SF-36 PCS, % (n/N) 27% (26/96) vs. 23% (22/95), RR 1.16 (95% CI 0.72 to 1.91) Baseline (mean, SD): 27.1 (6.9) vs 27.2 (7.0) Short term: 1.35 (0.27 to 2.43) vs. 0.78 (−0.30 to 1.86), difference in change scores 0.57 (95% CI −0.95 to 2.1) Proportion of patients considered to be responders on the SF-36 MCS, % (n/N) 27% (26/96) vs. 27% (26/95), RR 0.99 (95% CI 0.62 to 1.6) A vs. B, Median (IQR) or Mean (95% CI) Baseline (mean, SD): 39.4 (12.2) vs 37.8 (9.8) Short term: 2.29 (0.41 to 4.18) vs. 1.15 (−0.73 to 3.03), difference in change scores 1.14 (95% CI −1.52 to 3.81) Generalized Anxiety Disorder-10 (scale NR) Baseline (median): 17.5 (IQR 13 to 26) vs 17.0 (IQR 13 to 23) Short term: −0.78 (–2.01 to 0.46) vs. – 0.54 (–1.80 to 0.72), difference in change scores −0.24 (95% CI −2.00 to 1.53) Major Depression Inventory (scale NR) Baseline (median): 18.0 (IQR 13 to 27) vs 21.0 (IQR 15 to 27) Short term: −1.73 (–3.19 to −0.27) vs. – 0.47 (–1.96 to 1.01), difference in change scores −1.26 (95% CI −3.34 to 0.82) | NR |
|
Basler, 1997 Germany Duration of pain: 129.6 months Fair |
A. Comprehensive pain management (n=36) 12 weeks (one 2.5-hour sessions per week) patients attended an outpatient review appointment (2-4 hours) at 1 and 3 months postdischarge group sessions, outpatient B. Usual Care (n=40) |
Mean age: 49 years % Male: 24% Race/ethnicity: NR Pain etiology/type: Chronic LBP Quebec Task Force on Spinal Disorders:
|
A vs. B, Mean (SD) VAS (0-10) Baseline: 4.58 (1.77) vs. 3.99 (1.02) Postintervention 4.08 (2.11) vs. 4.18 (1.37), difference −0.10 (95% CI −0.91 to 0.71) Short term: 3.71 (2.01) vs. NR Days without pain per week Baseline: 0.30 (1.11) vs. 0.26 (0.92) Postintervention: 0.58 (1.54) vs. 0.28 (0.85); difference 0.30 (95% CI −0.26 to 0.86) Short term: 0.93 (2.04) vs. NR Dusseldorf Disability Scale - physical function (0-5) Baseline: 1.98 (0.92) vs. 1.84 (0.64) Postintervention: 1.63 (0.87) vs. 1.84 (0.62); difference −0.21 (95% CI −0.55 to 0.13) Short term: 1.44 (0.82) vs. NR Days with pain medication per week Baseline: 3.02 (2.85) vs. 3.41 (2.76) Postintervention: 2.59 (2.91) vs. 3.23 (2.90); difference −0.64 (95% CI −1.97 to 0.69) Short term: 2.34 (2.86) vs. NR | NR | NR |
|
Bendix, 1996, 1998a, 1998b (PROJECT A) Denmark Mean duration of pain: NR (≥6 months) Fair |
A. Comprehensive pain management program (n=55): 3 weeks full time (39 hours/week), then 1 day weekly for 3 additional weeks patients participated in a 6-hour followup program) group sessions, outpatient B. Usual care (n=51) |
Median age:
Race/ethnicity: NR Pain etiology/type: Chronic LBP Disability: NR Comorbidities:
|
A vs. B, median (IQR) Back pain VAS (0-10) Baseline (median): 6.1 vs. 6.1 Short term (mean, SD): 5.7 (4.1) vs. 6.9 (2.2), difference −1.20 (95% CI −2.54 to 0.14) Long term (24 months) (mean, SD): 6.0 (3.7) vs. 6.5 (2.2), difference −0.50 (95% CI −1.70 to 0.70) Long term (60 months) (mean SD): 5.0 (2.2) vs. 5.0 (1.8), difference 0 (95% CI −0.84 to 0.84) Patient subjective disability due to back pain (0-30) Baseline (median): 16.9 vs. 15.9 Short term: 12.1 (7.2 to 16.8) vs. 16.8 (13.1 to 20.1), p<0.001 Long term (24 months): 16.0 (8 to 19) vs. 15.0 (11 to 18), p=0.9 Long term (60 months): 12.0 (NR) vs. 16.0 (NR), p=0.2 A vs. B, Median (IQR) Leg pain VAS (0-10) Baseline (median): 4.1 vs. 4.6 Short term: 3.5 (0.3 to 7.0) vs. 5.4 (3.0 to 7.3), p=0.17 Long term (24 months): 4.5 (1.0 to 7.0) vs. 4.0 (1.0 to 7.0), p=0.90 Long term (60 months): 4.0 (NR) vs. 5.0 (NR), p=0.60 | NR |
A vs. B, % (n/N) Proportion of patients taking prescription pain medications (opioids not specified) Baseline: 80% (36/45) vs. 73% (36/49), p=0.39 Short term: NR Long term (24 months): 72% (36/50) vs. 56% (27/49), p=0.20 Long term (60 months): NR Proportion of patients hospitalized due to low back pain, % (n/N) Short term: NR Long term (24 months): NR Long term (60 months): 22% (10/46) vs. 38% (16/42), p=0.09 Proportion of patients who underwent back surgery during the study period, % (n/N) 4 months: NR 24 months: NR 60 months: 7% (3/46) vs. 12% (5/42), p=0.40 |
|
Browne, 2013 Australia Duration of pain: 1 month Poor |
A. Comprehensive pain management program (n=69): Duration of treatment unclear (2.5 hours/week; 20 hours total) individual sessions; outpatient B. Usual care (n=73) |
Mean age: 37 years % Male: 75% Race/Ethnicity:
Pain etiology/type: Traumatic injury Mechanism of injury
Injury Severity Score: 9.6 Disability: NR Comorbidities: NR Mental Health History: 19% Pain Medications at discharge:
|
A vs. B, Mean (SD) BPI (0-10) Baseline: 5.12 (2.26) vs. 5.48 (2.11) Postintervention: 3.13 (2.03) vs. 3.03 (2.74), difference 0.10 (95% CI −1.06 to 1.26) FIM (scale 18-126) Baseline: NR Postintervention: 122.73 (4.74) vs. 123.00 (3.91), difference −0.27 (95% CI −2.40 to 1.86) |
A vs. B, Mean (SD) CES-D (0-60) Baseline: 16.56 (9.55) vs. 14.88 (11.23) Postintervention: 17.40 (12.39) vs. 14.97 (11.48); difference 2.43 (95% CI −3.44 to 8.30) A vs. B, % (n/N) * Clinical Pain Diagnosis at 6 months (made by attending Pain Specialist, includes both nociceptive and neuropathic pain)
Postintervention: 50.0% (16/31) vs. 45.2% (16/35); RR 1.13 (95% CI 0.69 to 1.86) Walking Impairment (yes) Postintervention: 56.0% (17/31) vs. 37.9% (13/35); RR 1.48 (95% CI 0.86 to 2.52) *numerators back-calculated using % and denominator provided | NR |
|
de Buck, 2005 The Netherlands Duration of pain: Group A.11.0 months Group B. 19.5 months Fair |
A. Comprehensive pain management program (n=74): Duration NR (average between 4 and 12 weeks) Individual or group sessions NR; outpatient B. Usual care (n=66) |
Median age:
Race/Ethnicity: NR Median duration of disease:
|
A vs. B, Mean (95% CI) change scores from baseline VAS (0-10) Baseline (mean, SD): 4.37 (2.31) vs. 4.71 (2.27) Intermediate term change: −0.70 (95% CI −1.40 to 0.01) vs. −0.20 (95% CI −0.81 to −0.41) Long term (12 months) change: −0.31 (95% CI −1.08 to 0.47) vs. −0.58 (95% CI −1.28 to 0.13) Long term (18 month) change: −0.43 (95% CI −1.19 to 0.32) vs. −0.33 (95% CI −1.00 to 0.34) Long term (24 month) change: −0.59 (95% CI −1.28 to 0.09) vs. −0.42 (95% CI −1.16 to 0.32) HAQ (0-3) Baseline (mean, SD): 0.76 (0.50) vs. 0.83 (0.55) Intermediate term change: 0.03 (95% CI −0.08 to 0.13) vs. −0.04 (95% CI −0.16 to 0.08) Long term (12 months) change: −0.04 (95% CI −0.15 to 0.06) vs. −0.07 (95% CI −0.19 to 0.05) Long term (18 month) change: 0.00 (95% CI −0.11 to 0.11) vs. 0.08 (95% CI −0.04 to 0.21) Long term (24 month) change: −0.01 (95% CI −0.14 to 0.12) vs. −0.10 (95% CI −0.23 to 0.03) |
A vs. B, Mean (95% CI) change scores from baseline RAND 36-item Health Survey PCS (0-100) Baseline (mean, SD): 40.64 (17.66) vs. 43.32 (19.03) Intermediate term change: 5.75 (95% CI −0.45 to 11.95) vs. 5.96 (95% CI 0.38 to 11.53) Long term (12 months) change: 13.6 (95% CI 7.04 to 20.18) vs. 11.7 (95% CI 5.04 to 18.39) Long term (18 month) change: 13.78 (95% CI 6.32 to 21.25) vs. 9.32 (95% CI 2.75 to 15.9) Long term (24 month) change: 13.72 (95% CI 6.73 to 20.71) vs. 11.69 (95% CI 5.36 to 18.02) RAND 36-item Health Survey MCS (0-100) Baseline (mean, SD): 59.59 (24.08) vs. 64.10 (23.31) Intermediate term change: −1.4 (95% CI −8.40 to 5.54) vs. 1.72 (95% CI −5.05 to 8.50) Long term (12 months) change: 5.31 (95% CI −1.99 to 12.61) vs. 3.33 (95% CI −4.42 to 11.08) Long term (18 month) change: 11.20 (95% CI 2.40 to 20.06) vs. 3.60 (95% CI −4.78 to 12.00) Long term (24 month) change: 13.61 (95% CI 6.61 to 20.60) vs. 2.16 (95% CI −5.30 to 9.62) HADS anxiety (0-21) Baseline (mean, SD): 7.20 (4.00) vs. 6.80 (4.10) Intermediate term change: −0.30 (95% CI −1.78 to 0.11) vs. −0.43 (95% CI −1.39 to 0.54) Long term (12 months) change: −0.83 (95% CI −1.78 to 0.11) vs. −0.25 (95% CI −1.37 to 0.89) Long term (18 month) change: −0.94 (95% CI −1.87 to −0.02) vs. −0.34 (95% CI −1.53 to 0.89) Long term (24 month) change: −1.83 (95% CI −2.86 to −0.80) vs. −0.03 (95% CI −1.26 to 1.34) HADS depression (0-21) Baseline (mean, SD): 6.10 (3.30) vs. 5.70 (3.50) Intermediate term change: −0.02 (95% CI −1.05 to 1.01) vs. 0.28 (95% CI −0.54 to 1.10) Long term (12 months) change: −0.46 (95% CI −1.50 to 0.57) vs. 0.02 (–0.89 to 0.92) Long term (18 month) change: −0.64 (95% CI −1.71 to 0.44) vs. −0.21 (95% CI −0.36 to 0.93) Long term (24 month) change: −1.66 (95% CI −2.72 to −0.60) vs. 0.15 (95% CI −1.12 to 1.42) | NR |
|
Härkäpää, 1989, 1990 Finland Duration of pain:168 months Poor |
A. Comprehensive pain management program Inpatient group (n=156) 2 times a week for 2 months (15 sessions) (+ 2-week refresher sessions after 1.5 years) group sessions; inpatient B. Comprehensive pain management program Outpatient group (n=150) 2 times a week for 2 months (15 sessions) (+ 8 refresher sessions after 1.5 years) group sessions; outpatient C. Usual Care (n=153) |
Mean age: 45 years % Male: 63% Race/Ethnicity: NR Pain etiology/type: Chronic LBP
|
A vs. B vs. C, Mean (SD) Pain Index (0-400) Baseline: 184.9 (76.9) vs. 178.6 (81.8) vs. 175.8 (87.3) Short term: 128 (NR) vs. 146 (NR) vs. 162 (NR) Intermediate term: 158 (NR) vs. 160 (NR) vs. 154.5 (NR) Long term (18 months): 156.5 (NR) vs. 174 (NR) vs. 161(NR) Long term (22 months): 149 (NR) vs. 164 (NR) vs. 161.5 (NR) Long term (30 months): 161.5 (NR) vs. 168 (NR) vs. 158.5 (NR) LBP Disability Index (0-45) Baseline: 16.7 (7.9) vs. 17.6 (7.4) vs. 16.7 (8.4) Short term: 15.7 (NR) vs. 16 (NR) vs. 15.9 (NR) Intermediate term: 15.7 (NR) vs. 16 (NR) vs. 15.9 (NR) Long term (18 months): 15.55 (NR) vs. 17.05 (NR) vs.16.0 (NR) Long term (22 months): 14.5 (NR) vs. 15.65 (NR) 15.65 vs. (NR) Long term (30 months): 15.4 (NR) vs. 16.55 (NR) vs. 15.8 (NR) |
A vs. B %, p-value Benefits of treatment Short term:
| NR |
|
Jensen, 2001 Sweden Duration of pain: 31 months Fair |
A. Comprehensive pain management program (n=63): 4 weeks*, (20 hours a week, 80 hours total) group sessions; outpatient * (plus six 90-minute booster sessions over a period of 1 year after treatment) B. Usual care (n=48) |
Mean age: 43 years % Male: 45% Race/ethnicity:
| NR |
A vs. B, Mean (SD) SF-36 Global health (scale 0-100) Females only A vs. B (n=30 vs. 28) Baseline: 38.1 (14.5) vs. 45.6 (16.5) Postintervention: 47.6 (18.0) vs. 47.0 (15.2); difference 0.60 (95% CI −8.12 to 9.40) Intermediate term: 52.4 (21.6) vs. 46.3 (19.3); difference 6.10 (95% CI −4.70 to 16.90) Long term (18 months): 53.1 (24.5) vs. 43.4 (20.1); difference 9.70 (95% CI – 2.14 to 21.5) Males only A vs. B (n=33 vs. 20) Baseline: 41.6 (14.6) vs. 45.0 (14.7) Postintervention: 48.5 (17.2) vs. 45.1 (13.2); difference 3.40 (95% CI −5.61 to 12.41) Intermediate term: 54.3 (18.3) vs. 51.5 (24.2); difference 2.80 (95% CI −8.97 to 14.57) Long term (18 months): 57.2 (21.8) 45.9 (21.2); difference 11.30 (95% CI −0.98 to 23.58) |
A vs. B, Mean (SD) Harms: NR Perceived appropriateness of the treatment program to treating patient’s pain Females only Postintervention: 6.4 (3.1) vs. NR Males only Postintervention: 6.0 (3.6) vs. NR |
|
Johansson, 1998 Norway Duration of pain: 132 months Fair |
A. Comprehensive pain management program (n=21): 5 days a week for 5 weeks, (hours total NR) * group sessions; inpatient and outpatient *(+ booster sessions after 2 months) B. Waitlist control (n=21): |
Mean age: 44 years % Male: 22% Race/ethnicity: NR Pain etiology/type: Chronic musculoskeletal pain Disability: NR
|
A vs. B, Mean (SD) VAS pain intensity (0-10) Baseline: 5.28 (1.72) vs. 5.33 (1.84) Postintervention: 4.93 (2.19) vs. 5.22 (2.19), difference −0.29 (95% CI −1.72 to 1.14) Short term: 5.42 (2.42) vs. 5.32 (1.77), difference 0.10 (95% CI – 1.30 to 1.50) VAS pain interference (0-10) Baseline: 5.08 (1.85) vs. 4.69 (1.50) Postintervention: 4.23 (2.23) vs. 4.82 (2.31), difference −0.59 (95% CI −2.13 to 0.95) Short term: 4.76 (2.36) vs. 4.82 (1.72), difference −0.06 (95% CI – 1.45 to 1.33) MPI general activity level (0-6) Baseline: 2.8 (0.7) vs. 2.8 (0.7) Postintervention: 3.0 (0.7) vs. 2.6 (0.7), difference 0.40 (95% CI −0.08 to 0.88) Short term: 2.9 (0.7) vs. 2.4 (0.7), difference 0.50 (95% CI 0.03 to 0.98) | NR | NR |
|
Lemstra, 2005 Canada Duration of pain: 121 months Fair |
A. Comprehensive pain management program (n=43): 6 weeks, (18 one-hour sessions 18 hours total) group sessions; outpatient setting B. Usual care (n=36): |
Mean age: 50 % Male: 15% Race/ethnicity: NR Pain etiology/type: Fibromyalgia Disability: NR Comorbidities (all self-reported):
|
A vs. B, Mean (SD) changes scores from baseline VAS average pain in last month (0-10) Baseline (mean, SD): 7.14 (1.37) vs. 7.56 (1.38) Postintervention change: −1.02 (1.48) vs. −0.22 (1.2), difference in change scores −0.80 (95% CI −1.46 to −0.14) Number of days in last month with pain Baseline (mean, SD): 28.86 (3.19) vs. 28.82 (4.45) Postintervention change: −7.49 (9.35) vs. −1.17 (6.36), difference in change scores −6.32 (95% CI – 10.28 to −2.36) PDI (0-70) Baseline (mean, SD): 33.63 (10.78) vs. 33.47 (7.89) Postintervention change: −8.70 (8.93) vs. −1.97 (9.36), difference in change scores −6.73 (95% CI – 11.07 to −2.38) |
A vs. B, Mean (SD) changes scores from baseline BDI (0-63) Baseline (mean, SD): 18.23 (10.72) vs. 17.89 (10.03) Postintervention change: −7.74 (6.92) vs. −0.97 (4.5), difference in change scores −6.77 (95% CI −9.67 to −3.87) Self-reported health status (0-5) Baseline (mean, SD): 3.60 (1.03) vs. 3.67 (0.89) Postintervention change: −0.60 (0.12) vs. 0.03 (0.11), difference in change scores −0.63 (95% CI −0.95 to −0.31) | NR |
|
Linton, 2005 Sweden Duration of pain: NR (>12 weeks: 84%) Fair |
A. Comprehensive pain management program (n=69): 6 weeks (1x/week, 2 hours, at least 12 total) group sessions; outpatient setting B. Usual care (n=47) |
Mean age: 48 years % Male: 16% Race/ethnicity: NR Pain etiology/type:
Comorbidities: NR |
Mean (SD) Average pain last week (0-10) Baseline: 4.4 (2.1) vs. 5.0 (2.3) Long term (12 months): 2.9 (2.1) vs. 4.1 (2.8), difference −1.20 (95% CI – 2.19 to −0.21) Average pain last 3 months Baseline: 4.5 (1.9) vs. 4.7 (1.6) Long term (12 months): 3.0 (1.8) vs. 4.1 (2.5), difference −1.10 (95% CI −1.94to −0.26) Worst pain last 3 months Baseline: 6.0 (2.3) vs. 6.2 (2.1) 12 months: 4.3 (2.8) vs. 5.4 (2.8), difference −1.10 (95% CI −2.21 to 0.01) Pain-free days in last week (0-7) Baseline: 2.3 (2.5) vs. 2.2 (2.5) Long term (12 months): 3.5 (3.0) vs. 2.8 (2.7), difference 0.70 (95% CI – 0.44 to 1.84) Modified RMDQ (0-18) Baseline: 3.7 (4.5) vs. 3.3 (3.7) Long term (12 months): 3.4 (4.2) vs. 4.0 (4.7), difference −0.60 (95% CI – 2.34 to 1.14) Activities of Daily Living (0-50) Baseline: 38.9 (10.6) vs. 40.0 (8.2) Long term (12 months): 41.5 (10.4) vs. 41.1 (8.9), difference 0.40 (95% CI −3.48 to 4.28) |
Mean (SD) HADS Anxiety (0-21) Baseline: 4.9 (3.8) vs. 6.1 (4.2) Long term (12 months): 5.2 (3.6) vs. 7.1 (4.9), difference −1.9 (95% CI −3.55 to – 0.25) HADS Depression (0-21) Baseline: 3.8 (3.4) vs. 4.3 (3.7) Long term (12 months): 3.8 (3.6) vs. 4.5 (4.4), difference −0.70 (95% CI −2.26 to 0.86) | NR |
|
Peters 1990, 1992 New Zealand Duration of pain: 6 to 48 months,49%; 48 months to 240+ months, 51% Poor |
A. Comprehensive pain management program, Inpatient group (n=23): 5 days a week for 4 weeks, (hours total unclear) group sessions; inpatient (Monday – Friday) B. Comprehensive pain management program, Outpatient group (n=29) 9 weeks, (one 2-hour session per week, 18 hours total) group sessions; outpatient C. Usual care (n=16) |
Mean age: 44 years % Male: 38% Race/Ethnicity:
Comorbidities: NR |
A vs. B vs. C, Mean (SD) VAS pain (0-10) A vs. C Baseline: 5.12 (2.56) vs. 4.21 (2.55) Postintervention: 3.92 (2.33) vs. 5.29 (2.70) B vs. C Baseline: 5.25 (2.46) vs. 4.21 (2.55) Postintervention: 4.25 (2.18) vs. 5.29 (2.70) SIP (0-100) A vs. C Baseline: 204.31 (75.43) vs. 165.00 (125.26) Postintervention: 122.89 (80.84) vs. 180.67 (152.40) Long-term followup: NR B vs. C Baseline: 137.78 (105.49) vs. 165.00 (125.26) Postintervention: 96.00 (78.84) vs. 180.67 (152.40) A vs. B vs. C, % (n/N) Proportion of patients taking an opioid Baseline: Any opioid: 31.8% (7/22) vs. 33% (6/18) vs. 50% (6/12)
Long-term followup: Any opioid: 13.6% (3/22) vs. 22% (4/18) vs. 66.7% (8/12)
|
A vs. B vs. C, Mean (SD) BDI (0-63) A vs. C Baseline: 19.18 (9.34) vs. 12.33 (7.29) Postintervention: 12.25 (15.64) vs. 11.07 (5.82) B vs. C Baseline: 13.55 (6.03) vs. 12.33 (7.29) Postintervention: 10.73 (6.16) vs. 11.07 (5.82) GHQ (0-36) A vs. C Baseline: 15.52 (8.58) vs. 11.50 (10.08) Postintervention: 5.96 (7.11) vs. 10.36 (9.46) B vs. C Baseline: 8.67 (7.23) vs. 11.50 (10.08) Postintervention: 5.91 (6.42) vs. 10.36 (9.46) A vs. B vs. C, % (n/N) Proportion of patients reported to be “nonactive” (i.e., those receiving accident compensation, unemployment benefit, sickness benefit, invalids benefit, health insurance, or unable to manage a home) % (n/N) Baseline: 82% (18/22) vs. 67% (13/18) vs. 33% (4/12) Postintervention: NR Long-term followup: 18% (4/22) vs. 33% (6/18) vs. 58% (7/12) Proportion of patients demonstrating treatment “success” (using medication appropriately + active + no pain increase), % (n/N) Postintervention: NR Long-term followup: 68% (15/22) vs. 61% (11/18) vs. 25% (3/12) | NR |
|
Saral, 2016 Turkey Duration of pain: 90 months Fair |
A. Comprehensive pain management program, long-term group (n=22): 10 weeks (~7.5 hours/week; ~75 hours total); group + individual sessions; outpatient B. Comprehensive pain management program, short-term group (n=22): 2 days (~10 hours total); group + individual sessions; outpatient C. Usual care (n=22) |
Mean age: 42 years % Male: 0% (female only for inclusion) Race/ethnicity: NR Pain etiology/type: Fibromyalgia Disability: NR Comorbidities: NR Other characteristics:
|
A vs. B vs. C, Mean (SD) VAS pain (0-10) Baseline: 8.2 (0.9) vs. 7.6 (0.8) vs. 7.5 (0.9) Intermediate term: 5.1 (2.4) vs. 5.8 (1.0) vs. 7.6 (1.4) FIQ (0-100) Baseline: 71.6 (14.2) vs. 67.7 (12.0) vs. 65.5 (13.2) Intermediate term: 53.9 (19.3) vs. 54.5 (14.2) vs. 65.5 (11.5) |
A vs. B vs. C, Mean (SD) BDI (0-63) Baseline: 23.4 (11.0) vs. 20.7 (6.6) vs. 21.4 (10.4) Intermediate term:16.6 (9.6) vs. 15.0 (10.2) vs. 18.7 (9.5) Baseline: 32.8 (7.9) vs. 36.5 (8.7) vs. 36.0 (7.2) Intermediate term: 39.9 (7.5) vs. 39.6 (8.1) vs. 34.3 (8.1) Baseline: 30.4 (11.7) vs. 33.2 (8.9) vs. 36.1 (9.8) Intermediate term: 40.7 (12.3) vs. 40.2 (10.0) vs. 37.6 (10.0) | NR |
|
Scholten, 1999 Austria Duration of pain: 106.8 months Poor |
A. Comprehensive pain management program (n=38): 9 days over 2 weeks, (unclear hours total) group; outpatient setting B. Waitlist control (n=30): |
Mean age: 48 years % Male: 21% Race/ethnicity: NR Pain etiology/type: Rheumatoid arthritis Joint status (Steinbrocker’s criteria):
Comorbidities: NR |
A vs. B, mean (SD) Stanford Health Assessment Questionnaire (1-5) Baseline: 2.6 (0.78) vs. 2.9 (0.62) Postintervention: 1.6 (0.41) vs. 2.9 (0.68) Short term: 1.8 (0.54) vs. 2.7 (0.71) Intermediate term: 2.2 (0.32) vs. 2.6 (0.69) |
A vs. B, mean (SD) BDI (0-63) Baseline: 12.1 (6.2) vs. 12.0 (6.4) Postintervention: 6.9 (3.6) vs. 12.2 (6.5) Short term: 8.2 (3.0) vs. 11.9 (7.0) Intermediate term: 9.6 (2.3) vs. 12.1 (6.5) FQCI, Depression (5-25) Baseline: 12.7 (6.6) vs. 11.9 (5.3) Postintervention: 10.7 (4.2) vs. 12.4 (5.9) Short term; 10.0 (3.7) vs. 12.3 (5.9) Intermediate term: 10.8 (2.0) vs. 12.7 (6.2) | NR |
|
Smeets, 2006a, 2008 Netherlands Duration of pain: 56.7 months Cluster RCT Fair |
A. Comprehensive pain management program (n=61): 3 days a week for 10 weeks, (1.75 hours/day, 3 times a week 52.5 hours total) Group and individual sessions; outpatient setting B. Waitlist control (n=51): |
Mean age: 42 years % Male: 53% Race/ethnicity: NR Mean duration of functional limitations: 35.1 months Pain etiology/type: Chronic LBP
Other characteristics:
|
VAS, current pain (0-10) Baseline: 4.598 (2.395) vs. 5.102 (2.540) Postintervention: 4.231 (2.556) vs. 5.335 (2.26); adjusted difference −0.823 (95% CI −1.637 to −0.010)a VAS, main complaints (0-10) Baseline: 7.244 (1.703) vs. 7.742 (1.135) Postintervention: 5.468 (2.179) vs. 7.425 (1.47); adjusted difference −1.784 (95% CI −2.654 to −0.914)a PRI-T (scale NR) Baseline: 18.08 (9.04) vs. 17.37 (8.52) Postintervention: 17.53 (10.53) vs. 17.28 (10.48); adjusted difference −0.33 (95% CI −4.14 to 3.48)a RMDQ (0-24) Baseline: 13.51 (3.92) vs. 13.96 (3.88) Postintervention: 11.40 (5.25) vs. 13.88 (4.78); adjusted MD −2.56 (95% CI −4.27 to −0.85)a |
BDI (0-63) Baseline: 9.75 (6.68) vs. 9.78 (7.67) Postintervention: 9.07 (6.53) vs. 9.42 (7.81); adjusted difference 0.04 (95% CI −1.71 to 1.79)a Global Improvement (1-7) Postintervention: 4.53 (1.33) vs. 3.78 (0.91); adjusted difference 0.70 (95% CI 0.17 to 1.24)a |
Harms: Increased pain in the lower back or radiating leg pain: 5.5% (3/55) Satisfaction (0-100 VAS): 10th percentile of baseline RMDQ (=9): Postintervention: 64.98 (25.30) vs. 45.65 (25.30); adjusted MD 19.33 (95% CI 2.01 to 36.65)a 50th percentile of baseline RMDQ (=14) Postintervention: 70.24 (25.30) vs. 46.67 (25.30); adjusted MD 23.57 (95% CI 11.28 to 35.86)a 90th percentile of baseline RMDQ (=19) Postintervention: 75.50 (25.30) vs. 47.69 (25.30); adjusted MD 27.81 (95% CI 9.54 to 46.08)a |
|
Smith, 2019 Australia Duration of pain: >60 months, 59% <5 60 months, 41% Fair |
A. Comprehensive pain management program (n=41): 8 (online lessons with a 2-week gap between each lesson) 16 weeks, (hours total NR) Individual sessions; outpatient (online) B. Usual care (n=39): |
Mean age: 45 years % Male: 12.5% Race: NR Pain etiology/type: Chronic pain
Comorbidities: NR Prescribed medication:
|
A vs. B, estimated marginal mean (SD) BPI Severity (0-10) Baseline: 5.40 (1.66) vs. 5.05 (1.66) Postintervention: 4.44 (1.56) vs. 4.73 (1.63), difference −0.29 (95% CI −1.07 to 0.49) Short term: 4.38 (1.58) vs. 4.77 (1.64), difference −0.39 (95% CI – 1.18 to 0.40) BPI Interference (0-10) Baseline: 6.70 (2.10) vs. 5.88 (2.10) Postintervention: 4.90 (1.98) vs. 4.82 (2.04) Short term: 5.19 (1.98) vs. 4.64 (2.05) PDI (scale 0-70) Baseline: 38.33 (10.07) vs. 37.06 (10.04) Postintervention: 26.59 (9.88) vs. 33.64 (9.97) Short term: 30.47 (9.89) vs. 32.44 (9.94) A vs. B, % (n/N) Opioid use Baseline: 56.1% (23/41) vs. 51.3% (20/39) Postintervention: 63.3% (19/30) vs. 50.0% (17/34) Short term: 60.0% (18/30) vs. 51.5% (17/33) |
A vs. B, estimated marginal mean (SD) PHQ-9 (0-27) Baseline: 11.42 (5.78) vs. 10.55 (5.88) Postintervention: 9.58 (5.36) vs. 9.51 (5.70) Short term: 9.81 (5.45) vs. 9.26 (5.65) Major Depressive Disorder Diagnosis: Baseline: 34% (12/35) vs. 18% (6/33) Short term: 17% (6/35) vs. 33% (11/33) | NR |
|
Turner, 1990 USA Duration of pain: 155 months Poor |
A. Comprehensive pain management program (n=18): 8 weeks (4 hours/week, 32 hours total); group + individual sessions; outpatient B. Waitlist control (n=39) |
Mean age: 44 years % Male: 52.1% Race/ethnicity: White: 100% Pain etiology/type: Chronic LBP Disability: NR Comorbidities: NR |
A vs B, Mean (SD) MPQ (0-78) Baseline: 25.54 (12.41) vs. 21.17 (8.84) Postintervention: 14.78 (11.44) vs. 20.95 (10.62) [on a 0-10 scale, 1.9 (1.5) vs. 2.7 (1.4), difference −0.79 (95% CI −1.70 to 0.12)] Baseline: 8.50 (4.59) vs. 6.24 (4.99) Postintervention: 3.63 (2.98) vs. 5.37 (5.93) |
A vs. B, Mean (SD) CES-D (0-60) Baseline: 12.38 (7.31) vs.10.48 (4.19) Postintervention: 7.36 (5.89) vs. 7.03 (5.02) |
A vs. B, Mean (SD) Patient satisfaction (1-7) 5.50 (NR) vs. NR |
|
van Eijk-Hustings, 2013, 2016 Netherlands Duration of pain: 81.6 months Fair |
A. Comprehensive pain management program (n=108): 12 weeks*, (2x/week, 1.5 hours/day 36 hours total) group sessions outpatient setting *(+ 9-month aftercare program) B. Usual care (n=48): |
Mean age: 42 years % Male: 4% Race/ethnicity: NR Pain etiology/type: Fibromyalgia Disability: NR Comorbidities: NR |
A vs. B, Estimated marginal means (SD) FIQ Total (0-100) Baseline: 64.5 (14.55) vs. 55.4 (15.93) Postintervention: 55.1 (15.59) vs. 58.1 (15.93) Long term (18 months): 50.9 (20.78) vs. 56.2 (20.09); effect size 0.25 (95% CI −0.09 to 0.59) |
A vs. B, Estimated marginal means (SD) EQ-5D scale? Baseline: 0.36 (0.31) vs. 0.51 (0.28) Postintervention: 0.49 (0.31) vs. 0.50 (0.28) Long term (18 months): 0.55 (0.31) vs. 0.51 (0.35); effect size 0.12 (95% CI −0.22 to 0.46) EQ5D VAS, overall impression of health (0-100) Baseline: 48.1 (17.67) vs. 54.0 (18.01) Postintervention: 54.0 (19.75) vs. 48.3 (20.09) Long term (18 months): 57.3 (23.90) vs. 51.9 (22.89); effect size 0.22 (95% CI – 0.12 to 0.56) FIQ, Depression (0-10) Baseline: 5.2 (3.12) vs. 4.2 (2.77) Postintervention: 4.1 (3.12) vs. 4.5 (2.77) Long term (18 months): 3.9 (3.12) vs 4.2 (2.77); A vs. B, effect size 0.10 (95% CI – 0.24 to 0.44) FIQ, Anxiety (0-10) Baseline: 5.9 (3.12) vs. 4.8 (2.77) Postintervention: 5.0 (2.08) vs. 5.2 (2.77) Long term (18 months): 4.7 (3.12) vs. 4.8 (2.77); A vs. B, effect size 0.03 (95% CI – 0.31 to 0.37) |
A vs. B, Estimated marginal means (SD) Average resource use per patient per 2 months, mean (IQR) or % (n/N): Formal home help: Baseline: 0.2 (0 to 0) vs. 0.1 (0 to 0) During intervention: 0.4 (0 to 0) vs. 0.6 (0 to 0) Postintervention: 0.4 (0 to 0) vs. 0.5 (0 to 0) Paid home help: Baseline: 0.1 (0 to 0) vs. 0.2 (0 to 0) During intervention: 0 (0 to 0) vs. 0.1 (0 to 0) Postintervention: 0.3 (0 to 0.5) vs. 0.1 (0 to 0.2) Informal care: Baseline: 0.6 (0 to 0) vs. 0.3 (0 to 0) During intervention: 1.6 (0 to 1.5) vs. 0.6 (0 to 0.4) Postintervention: 0.9 (0 to 1.1) vs. 0.6 (0 to 0.8) |
|
van Koulil, 2010, 2011 Netherlands Duration of pain: NR Cluster RCT Fair |
A. Comprehensive pain management program, pain avoidance treatment tailoring group (n = 29): 8 weeks (32 hours) + booster session (4 hours) 3 months after treatment conclusion (36 hours total); individual sessions; outpatient B. Comprehensive pain management program, pain persistence treatment tailoring group (n = 39): 8 weeks (32 hours) + booster session (4 hours) 3 months after treatment conclusion (36 hours total); individual sessions; outpatient C. Waitlist control, pain avoidance treatment (n = 45) D. Waitlist control, pain persistence treatment (n = 45) |
Mean age: 42 years Male: 6% Race/ethnicity: NR Pain etiology/type: Fibromyalgia Disability: NR Comorbidities:
|
A vs. B vs. C vs. D, Mean (SD) IRGL pain (6-25) Baseline: 20.3 (2.4) vs. 19.1 (3.7) vs. 19.8 (3.1) vs. 17.6 (3.4) Postintervention: 16.0 (3.2) vs. 15.9 (3.8) vs. 20.0 (4.3) vs. 17.4 (3.5) Short term: 17.2 (3.3) vs. 16.4 (5.1) vs. 20.4 (3.4) vs. 16.4 (3.6) FIQ (0 to 100) Baseline: 66.3 (11.6) vs. 57.2 (11.0) vs. 67.0 (11.8) vs. 54.1 (14.7) Postintervention: 47.6 (14.7) vs. 46.8 (15.3) vs. 63.6 (14.9) vs. 53.9 (12.8) Short term: 50.0 (15.6) vs. 43.2 (18.5) vs. 66.0 (13.9) vs. 50.8 (15.2) IRGL mobility (7-28) Baseline: 13.6 (3.0) vs. 18.6 (4.5) vs. 13.6 (3.0) vs. 18.7 (4.3) Postintervention: 18.4 (3.5) vs. 21.4 (4.0) vs. 14.5 (4.3) vs. 19.4 (4.1) Short term: 19.3 (3.8) vs. 22.2 (4.8) vs. 14.5 (4.2) vs. 19.8 (4.4) |
A vs. B vs. C vs. D, Mean (SD) IRGL negative mood scale (0-24) Baseline: 8.9 (3.8) vs. 5.9 (3.3) vs. 10.5 (5.7) vs. 5.6 (3.6) Postintervention: 4.7 (3.7) vs. 4.0 (3.5) vs. 8.8 (6.2) vs. 6.3 (3.7) Short term: 5.0 (3.5) vs. 3.5 (2.6) vs. 8.4 (5.2) vs. 6.1 (4.5) IRGL anxiety scale (10-40) Baseline: 26.3 (5.9) vs. 23.2 (4.3) vs. 27.0 (6.4) vs. 23.9 (5.1) Postintervention: 21.6 (5.9) vs. 20.6 (4.3) vs. 25.6 (6.7) vs. 23.6 (5.2) Short term: 20.3 (5.6) vs. 19.0 (4.4) vs. 26.0 (5.4) vs. 22.7 (5.4) | NR |
|
Weiner 2020 USA Duration of pain: 3 months Fair |
A. Comprehensive pain management program (n=25): duration NR, (6 months total) Individual or group sessions NR; outpatient setting B. Usual care (n=30): Standard clinical care |
Mean age: 69 years % Male: 96% Race:
Disability:
Current Medications:
|
A vs. B, Mean (SD) change scores from baseline to followup VAS pain, Current (0-10) Baseline: mean 4.5 (2.8) vs. mean 5.3 (2.4) Postintervention: 0.46 (2.99) vs.0.96 (2.18); unadjusted difference in change scores −0.46 (SE 0.72), p=0.53; adjustedb difference in change scores −1.07 (SE 0.59), p=0.07 VAS pain, Average over prior week (0-100) Baseline: mean 6.6 (1.7) vs. mean 6.5 (1.4) Postintervention: −1.38 (2.46) vs. – 0.08 (2.02); unadjusted difference in change scores −1.24 (SE 0.62), p=0.046; adjustedb MD in change scores −1.22 (SE 0.54), p=0.02 VAS pain, Worst pain over prior week (0-10) Baseline: mean 8.8 (1.5) vs. mean 8.5 (1.9) Postintervention: −2.25 (2.44) vs. – 0.42 (1.42); unadjusted difference in change scores −1.74 (SE 0.60), p=0.004; adjustedb difference in change scores −1.70 (SE 0.57), p=0.003 RMDQ (0-24) Baseline: mean 14.8 (5.1) vs. 15.1 (5.3) Postintervention −1.29 (6.05) vs. 0.08 (4.12); unadjusted difference in change scores −1.24 (SE 1.28), p=0.33; adjustedb difference in change scores −1.42 (SE 1.25), p=0.26 |
A vs. B, Mean (SD) change scores from baseline to followup SF-12 PCS (0-100) Baseline: mean 31.2 (8.1) vs. mean 32.5 (9.4) Postintervention: 1.46 (8.38) vs. −1.08 (8.84); unadjusted difference in change scores 2.36 (SE 2.23), p=0.29; adjustedb difference in change scores 2.17 (SE 2.12), p=0.31 SF-12 MCS (0-100) Baseline: mean 51.7 (11.4) vs. mean 51.3 (10.8) Postintervention: −1.14 (9.55) vs. −3.12 (10.59); unadjusted MD in change scores 2.12 (SE 2.60), p=0.42; adjustedb difference in change scores 2.47 (SE 2.46), p=0.32 | NR |
|
Whitfill, 2010 USA Duration of pain: Poor |
A. Comprehensive pain management program (n=90): 4 to 10 weeks; intensity unclear; individual sessions; outpatient B. Usual care (n=52) |
Mean age: 40 years % Male: 50% Race/ethnicity:
Disability: NR Other characteristics: NR |
A vs. B, Mean (SD) VAS pain (0-10) Baseline: 6.00 (2.07) vs. 5.95 (1.95) Intermediate term: 3.91 (2.86) vs. 5.07 (2.78), difference −1.16 (95% CI −2.26 to −0.06) CPI (0-10) Baseline: 5.23 (2.51) vs. 2.50 (2.45) Intermediate term: 2.96 (2.82) vs. 4.27 (3.01) |
A vs. B, Mean (SD) SF-36 (0 to 100) Baseline: 33.00 (8.09) vs. 35.99 (10.13) Intermediate term: 40.47 (11.47) vs. 39.45 (10.59) BDI (0 to 63) Baseline: 11.63 (9.30) vs. 9.43 (9.58) Intermediate term: 8.81 (9.49) vs. 10.11 (10.23) | NR |
|
Williams, 1996 UK Duration of pain: 93.7 months Poor |
A. Comprehensive pain management program, inpatient group (n=43): 4.5 days a week for 4 weeks, (28 hours total) group sessions; inpatient B. Comprehensive pain management program, outpatient group (n=45): 8 weeks, (3.5 hours a week, 28 hours total) group sessions outpatient C. Waitlist control (n=33) |
Mean age: 50 years % Male: 47% Race/ethnicity: Afro-Caribbean or Asian: 12%-16% White: 84%-88% Pain etiology/type: Mixed chronic pain
Receiving disability income: 62% Litigation related to pain: 21% Opioid use: 61% Excess drug use: 59% |
A vs. B vs. C, mean (SD) VAS pain intensity (0-10) Baseline: 7.11 (1.90) vs. 6.86 (1.49) vs. 6.79 (2.23) Short term: 6.10 (2.17) vs. 6.34 (1.96) vs. 6.81 (2.07); p=NS VAS pain distress (0-10) Baseline: 6.64 (2.24) vs. 7.03 (2.10) vs. 6.05 (2.31) Short term: 4.16 (2.90) vs. 5.42 (2.75) vs. 6.30 (2.53); p=NS SIP (0-100) Baseline: 29.53 (12.55) vs. 28.48 (9.49) vs. 28.44 (9.83) Short term: 15.81 (11.20) vs. 20.95 (10.29) vs. 29.65 (10.82); p<0.0005 A vs. B vs. C Opioid use: no use of opioids Baseline: 47% (18/38) vs. 33% (11/33) vs. NR Short term: 82% (31/38) vs. 57% (19/33) vs. NR Long term (12 months): 80% (24/38) vs. 55% (17/33) vs. NR Opioid dose equivalent to >10 mg morphine per day: Baseline: 34.2% (13/38) (mean 30 mg, maximum of 120 mg/day) vs. 48.5% (16/33) (mean 22 mg, maximum of 60 mg/day) vs. NR Short term: 10.5% (4/38) (maximum of 30 mg/day) vs. 33.3% (11/33) (maximum of 45 mg/day) vs. 32.3% (10/31), p=NS Long term (12 months): 10.5% (4/38) (mean 22 mg, maximum of 45 mg/day) vs. 18.2% (6/33) (mean 15 mg, maximum of 70 mg/day) vs. NR, p=NS |
A vs. B vs. C, mean (SD) BDI (0-63) Baseline: 17.8 (8.0) vs. 16.8 (5.6) vs. 16.6 (6.5) Short term: 9.5 (7.8) vs. 12.2 (6.3) vs. 17.3 (7.0); p<0.0005 STAI (20-80) Baseline: 45.1 (10.7) vs. 45.7 (8.2) vs. 44.8 (11.6) Short term: 36.8 (13.6) vs. 42.3 (10.6) vs. 45.0 (11.7), p<0.05 for all |
A vs. B vs. C Utilization: Subsequent treatments: |
ADL = activities of daily living;; BDI = Beck Depression Inventory; BPI = Brief Pain Inventory; CES-D = Center for Epidemiological Studies Depression Scale; CIS = Checklist Individual Strength; CPI = Characteristic Pain Inventory; EQ-5D = Five-dimensional EuroQol; FIM = Functional independence measure, FIQ = Fibromyalgia Impact Questionnaire; FQCI = Freiburg Questionnaire of Coping with Illness; GDS = General Depression Scale; GHQ = General Health Questionnaire; HADS = Hospital Anxiety and Depression Scale Anxiety; HAQ = Health Assessment Questionnaire; HRQOL = health-related quality of life; IRGL = Impact of Rheumatic Diseases on General Health and Lifestyle Instrument; IRQ = interquartile range; MPI = Multidimensional pain inventory; MPQ = The McGill Pain Questionnaire; NR = not reported; NRS = Numeric Pain Rating Scale; NS = not significant; PDI = Pain Disability Index; PHQ-9 = Patient Health Questionnaire–9; PRI-T = Pain Rating Index Total score; RA= Rheumatoid arthritis; RMDQ = Roland and Morris Disability Questionnaire; RCT = randomized controlled trial; SD = standard deviation; SE = standard error; SF-36 = Short-Form 36 questionnaire; SIP = Sickness Impact Profile; STAI = Spielberger State-Trait Anxiety Inventory; VAS = visual analog scale.
- a
Estimated adjusting for age, gender, center of treatment, baseline score of outcome measure, duration of functional limitations, and work status, based on a longitudinal random coefficient analysis with an extra random intercept for clusters of four patients being randomized together.
- b
Adjusted for baseline scores.
Table B-6Summary results for trials addressing KQ1: CPMPs versus physical activity
|
Author, Year Country Pain Duration Study Design Study Quality |
Intervention (n) Comparator (n) Duration/Intensity Session Format Setting (IP/OP) | Population |
Primary Outcomes: Pain, Function, and Opioid Use | Secondary Outcomes: HRQOL, Psychological Measures, Global Improvement | Harms, Utilization, Patient Satisfaction |
|---|---|---|---|---|---|
|
Alaranta, 1994 Finland Mean duration of pain: NR (≥6 months) Fair |
A. CPMP (n=152) 6 weeks, 52 hours total; group + individual; 3 weeks at home + 3 weeks inpatient B. PA (n=141) 3 weeks 45-60 hours total, session format NR, inpatient |
Mean age: 40 years Male: 45% Race/Ethnicity: NR Pain etiology/type: Chronic LBP Disability:
|
A vs. B, Mean (SD) MVAS disability (0-100) (f/u data estimated by EPC from Fig 4 of study publication) Baseline: 45.5 (18.8) vs. 45.1 (20.8) Short term: 28.5 (20.9) vs. 35.8 (20.3), difference −7.3 (95% CI −12.1 to 2.5) Intermediate term: 29.6 (23.2) vs. 36.1 (23.9), difference −6.5 (95% CI −12.0 to – 1.0) |
Symptom Check List Pain and Anxiety Subscales: Data not reported (p>0.05) BDI: Data not reported. |
A vs. B Harms: NR Decrease (%) in the number of yearly visits Physician: 74% vs. 67% Outpatient PT: 69% vs. 77% |
|
Bendix, 1995, 1997, 1998a, 1998b (PROJECT B) Denmark Mean duration of pain: NR (≥6 months) Fair |
A. CPMP, high intensity (n=46) 3 weeks (39 hours/week + one 6hour session /week for 3 weeks, group, outpatient B. CPMP, lower intensity (n=43) Twice weekly for 6 weeks (total 24 hours), group, outpatient C. PA (n=43) Twice weekly for 6 weeks (total 24 hours), group, outpatient |
Mean age: 42 years Male: 25% Race/Ethnicity: NR Pain etiology/type: Chronic LBP Disability: Patient’s perception of disability due to back pain (0-30): 15 Comorbidities: Smoker: 66% Prior back surgery: 21% Disability Index (from LBP Rating Scale, 0-30) Baseline: 15.5 (NR) vs. 15.3 (NR) vs. 14.4 (NR) Short term: 8.5 (5 to 15) vs. 16.1 (11 to 19) vs. 13.5 (10 to 17), p=0.002 for A vs. B and A vs. C Long term (12 months): 8.9 (5 to 13) vs. 16.4 (14 to 19) vs. 13.7 (9 to 17), p<0.001 for A vs. B and A vs. C Long term (24 months): 10 (6 to 14) vs. 17 (9 to 21) vs. 14 (9 to 17), p=0.002 for A vs. B, p=0.02 for A vs. C Long term (60 months): 8 (NR) vs. 16 (NR) vs. 14 (NR), p=0.03 for A vs. B, p=0.01 for A vs. C |
A vs. B vs. C, Median (IQR) Back pain VAS (0-10) Baseline: 5.3 (NR) vs. 5.9 (NR) vs. 5.4 (NR) Short term: 2.7 (1.4 to 4.3) vs. 5.6 (3.8 to 7.6) vs. 4.4 (2.4 to 6.2), p<0.001 for A vs. B and A vs. C Long term (12 months): 3.3 (2.1 to 5.6) vs. 6.5 (4.8 to 7.7) vs. 5.3 (3.3 to 7.6), p=0.005 for A vs. B and A vs. C Long term (24 months): 3 (2 to 6) vs. 6 (4 to 8) vs. 5 (3 to 7), p=0.003 for A vs. B, p=0.07 for A vs. C Long term (60 months): 4 (NR) vs. 6 (NR) vs. 5 (NR), p=0.3 Leg pain VAS (0-10) Baseline: 2.9 (NR) vs. 3.7 (NR) vs. 3.7 (NR) Short term: 0.4 (0 to 2.3) vs. 3.1 (0.5 to 5.9) vs. 2.6 (0.1 to 4.6), p=0.01 for A vs. B and A vs. C Long term (12 months): 2.1 (0.2 to 4.13) vs. 4.8 (2.3 to 7.3) vs. 2.8 (1.4 to 7.0), p=0.001 for A vs. B, p=0.04 for A vs. C Long term (24 months): 2 (0 to 5) vs. 5 (1 to 6) vs. 4 (2 to 6), p=0.08 Long term (60 months): 3 (NR) vs. 4 (NR) vs. 4 (NR), p=0.07 | NR |
A vs. B vs. C, Median (IQR) Harms: NR Number contacts to any health-care professional Short term: 0.5 (0 to 2.4) vs. 2.8 (0.4 to 4.6) vs. 1.3 (0.1 to 3.1), p=NS for A vs. B, p<0.05 for A vs. C Long term (12 months): 4.5 (0.3 to 12.3) vs. 12.0 (0.8 to 23.3) vs. 11.8 (4.0 to 25.0), p=0.002 for A vs. B and A vs. C Long term (24 months): 5 (0 to 19) vs. 21 (3 to 34) vs. 14 (7 to 27), p=0.03 Long term (60 months): 15 (NR) vs. 10 (NR) vs. 24 (NR), p=0.20 Proportion of patients hospitalized due to LBP, % (n/N) Long term (60 months): 22% (8/37) vs. 23% (7/31) vs. 24% (7/29), p=1.0 Proportion who underwent back surgery during study period, % (n/N) Long term (60 months): 5% (2/37) vs. 10% (3/31) vs. 10% (3/29), p=0.70 |
|
Bendix, 2000 Denmark Mean duration of pain: NR (≥6 months) Fair |
A. CPMP (n=59) 3 weeks (40 hours/week), then 1 day weekly for 3 weeks + a 6-hour follow-up, group, outpatient B. PA (n=68) 8 weeks (1.5 hour per day, 3x/week, 36 hours total), group, outpatient |
Median age: 41 years Male: 35% Race/Ethnicity: NR Pain etiology/type: Chronic LBP Disability:
Comorbidities: NR |
A vs. B, Median (IQR) Back pain VAS (0-10) Baseline: 5.1 (4 to 7) vs. 6.0 (5 to 7) Long term: 5.1 (2 to 7) vs. 5.7 (3 to 7.3) Leg pain VAS (0-10) Baseline: 2.2 (0 to 5) vs. 3.2 (0 to 6) Long term: 2.8 (0 to 7) vs. 3.5 (1 to 6.3) (ns) Disability Index (from LBP Rating Scale, 0-30) Baseline: 16 (12 to 20) vs. 16 (12 to 21) Long term: 12 (6 to 21) vs. 13 (9 to 19) |
A vs. B, Median (IQR) Overall assessment of how much the treatment influenced the QoL (0-5) Long term: 1.7 (1 to 3) vs. 2.7 (2 to 3.3) (P=0.03) |
A vs. B, Median (IQR) Harms: NR Number contacts to any health-care professional Long term: 2.5 (0 to 10) vs. 4 (0 to 12.3) (ns) |
|
Henchoz, 2010 Switzerland Mean duration of pain: NR (>6 weeks) Fair |
A. CPMP (n=40) 3 weeks (~31 hours/week, 93 hours total), group + individual, outpatient B. PA (n=27) 9 weeks (1.5 hours/week, 13.5 hours total), individual, outpatient |
Mean age: 40 years Male: 67% Race/Ethnicity: NR Pain etiology/type: LBP Disability: NR Comorbidities: NR |
A vs. B, Mean (SD) ODI (0-100) Baseline: 37.6 (15.8) vs. 39.1 (14.7) Postintervention: 30.1 (16.5) vs. 37.2 (13.5), difference −7.1 (95% CI −14.75 to 0.55) Short term: 25.7 (15.8) vs. 35.0 (12.3), difference −9.3 (95% CI −16.51 to −2.09) Intermediate term (6 months): 28.6 (18.4) vs. 35.4 (15.0), difference −6.8, (95% CI – 15.32 to 1.72) Intermediate term (9 months): 29.6 (17.9) vs. 39.8 (17.3), difference −10.2, (95% CI −18.99 to −1.41) Long term (12 months): 26.2 (18.0) vs. 38.0 (18.4), difference −11.8 (95% CI – 20.83 to −2.77) | NR | NR |
|
Jensen, 2001 Sweden Mean duration of pain: 31 months Fair |
A. CPMP (n=63) 4 weeks (20 hours/week, 80 hours total, plus six 90-minute booster sessions over 1 year after treatment), group, outpatient B. PA (n=54) Duration: 4 weeks (20 hours/week, 80 hours total, plus six 90-minute booster sessions over 1 year after treatment), group + individual, outpatient |
Mean age: 43 years % Male: 45% Race/Ethnicity:
Comorbidities: NR | NR |
A vs. B, Mean (SD) SF-36 Global health (0-100) Females only A vs. B (n=30 vs. 37) Baseline: 38.1 (14.5) vs. 35.1 (11.4) Postintervention: 47.6 (18.0) vs. 41.0 (15.1), difference 6.6 (95% CI −1.48 to 14.68) Intermediate term: 52.4 (21.6) vs. 43.6 (22.7), difference 8.8 (95% CI −2.10 to 19.70) Long term: 53.1 (24.5) vs. 47.2 (24.7), difference 5.9 (95% CI −6.18 to 17.98) Males only A vs. B (n=33 vs. 17) Baseline: 41.6 (14.6) vs. 42.6 (13.3) p=ns Postintervention: 48.5 (17.2) vs. 46.3 (14.4), difference 2.2 (95% CI −7.60 to 12.00) Intermediate term: 54.3 (18.3) vs. 50.3 (16.5), difference 4.0 (95% CI −6.64 to 14.64) Long term: 57.2 (21.8) vs. 52.4 (17.9), difference 4.8 (95% CI −7.56 to 17.16) |
A vs. B, Mean (SD) Harms: NR Perceived treatment appropriateness (0-10) Females only A vs. B (n=30 vs. 37) Postintervention: 6.4 (3.1) vs. 7.1 (3.4), difference −0.70 (95% CI −2.30 to 0.90) Males only A vs. B (n=33 vs. 17) Postintervention: 6.0 (3.6) vs. 6.3 (3.2), difference −0.30 (95% CI −2.38 to 1.78) Recommend treatment to relative with a similar pain (0-10) Females only A vs. B (n=30 vs. 37) Postintervention: 7.0 (3.7) vs. 7.9 (3.2), difference −0.90 (95% CI −2.58 to 0.78) Males only A vs. B (n=33 vs. 17) Postintervention: 6.1 (4.3) vs. 7.6 (3.8), difference −1.50 (95% CI −3.99 to 0.99) |
|
Jousett, 2004 France Mean duration of pain: NR Fair |
A. CPMP (n=43) 5 weeks (6 hours per day, 30 hours total), group + individual, outpatient B. PA (n=41) 5 weeks (3 hours per week in clinic, 2 hours per week at home, 25 hours total), individual, outpatient |
Mean age: 41 years % Male: 67% Race/Ethnicity: NR Pain etiology/type: Chronic LBP Disability:
|
A vs. B, Mean (SD) VAS pain (0-10) Baseline: 5.0 (2.2) vs. 4.6 (2.2) Intermediate term: 3.1 (2.5) vs. 4.0 (2.8), difference −0.90 (95% CI −2.04 to 0.24) Dallas Pain questionnaire ADLs subscale (0-100) Baseline: 53.7 (16.7) vs. 50.3 (16.7) Intermediate term: 36.7 (23.0) vs. 41.5 (24.4), difference −4.80 (95% CI −15.15 to 5.55) Quebec Back Pain Disability scale (0-100) Baseline: 34.6 (15.4) vs. 31.6 (15.9) Intermediate term: 22.0 (16.0) vs. 22.9 (17.7), difference −0.90 (95% CI −8.27 to 6.47) |
A vs. B, Mean (SD) HADS (0-21): Baseline: 17.0 (6.5) vs. 14.3 (6.2) Intermediate term: 12.7 (7.2) vs. 13.4 (6.4), difference −0.70 (95% CI −3.68 to 2.28) Dallas Pain Questionnaire anxiety/depression subscale (0-100): Baseline: 40.6 (25.3) vs. 31.8 (23.1) Intermediate term: 21.6 (22.9) vs. 27.8 (22.2), difference −6.20 (95% CI −16.05 to 3.65) |
A vs. B, % (n/N) or Mean (SD) Harms: NR Proportion seeking pain treatments Baseline: 85.7% (63/42) vs. 78.0% (32/41) Intermediate term: 64.3% (27/42) vs. 61.0% (25/41), RR 1.05 (95% CI 0.76 to 1.47) Treatment appreciation (1-5) Intermediate term: 1.9 (0.8) vs. 2.3 (0.9), difference −0.40 (95% CI −0.77 to −0.03) |
|
Kaapa, 2006 Finland Mean duration of pain: 26 months Fair |
A. CPMP (n=59) 8 weeks (70 hours total), group + individual, outpatient B. PA (n=61) 6-8 weeks (10 hours total), individual, outpatient |
Mean age: 46 % Male: 0% Race/Ethnicity: NR Pain etiology/type: Chronic LBP Disability: NR Comorbidities:
|
A vs. B, Mean (SD) Low back pain NRS (0-10) Baseline: 4.6 (1.9) vs. 5.0 (2.6) Postintervention: 3.3 (2.5) vs. 3.4 (2.4), difference −0.10 (95% CI −0.98 to 0.78) Intermediate term: 3.3 (2.5) vs. 3.4 (2.5), difference −0.10 (95% CI −1.01 to 0.81) Long term (12 months): 3.6 (2.7) vs. 3.4 (2.5), difference −0.20 (95% CI −0.80 to 1.20) Long term (24 months): 3.5 (2.6) vs. 4.0 (2.9), difference −0.50 (95% CI −1.61 to 0.61) Sciatic pain NRS (0-10) Baseline: 2.7 (2.7) vs. 3.1 (3.1) Postintervention: 2.2 (2.7) vs. 2.0 (2.6), difference 0.20 (95% CI −0.76 to 1.16) Intermediate term: 2.3 (2.8) vs. 1.8 (2.3), difference 0.50 (95% CI −0.45 to 1.45) Long term (12 months): 2.5 (3.0) vs. 2.0 (2.5), difference 0.50 (95% CI −0.56 to 1.56) Long term (24 months): 2.1 (2.8) vs. 2.7 (2.9) ODI (0-100) Baseline: 25.4 (10.6) vs. 23.8 (11.7) Postintervention: 20.9 (10.1) vs. 21.6 (11.4), difference −0.70 (95% CI −4.60 to 3.20) Intermediate term: 20.4 (11.6) vs. 18.0 (11.5), difference 2.4 (95% CI −1.87 to 6.67) Long term (12 months): 18.9 (12.8) vs. 18.5 (12.4), difference 0.40 (95% CI −4.43 to 5.23) Long term (24 months): 19.7 (14.3) vs. 19.3 (13.1), difference 0.40 (95% CI −5.20 to 6.00) |
A vs. B, Mean (SD) Symptoms of depression (DEPS) (0–30) Baseline: 7.5 (5.2) vs. 6.7 (5.5) Postintervention: 5.5 (5.5) vs. 5.7 (5.2), difference −0.20 (95% CI −2.13 to 1.73) Intermediate term: 5.7 (4.6) vs. 5.8 (5.7), difference −0.10 (95% CI −2.01 to 1.81) Long term (12 months): 6.6 (5.8) vs. 5.0 (4.0), difference 1.60 (95% CI −0.31 to 3.51) Long term (24 months): 6.7 (5.3) vs. 5.7 (4.7), difference 1.00 (95% CI – 1.05 to 3.05) |
A vs. B, Mean (SD) Harms: NR Number contacts to any health-care professional Long term (12 months): 5.8 (9.9) vs. 5.4 (8.2), difference 0.40 (95% CI −3.08 to 3.88) Long term (24 months): 3.4 (7.0) vs. 5.3 (8.6), difference −1.90 (95% CI −5.09 to 1.29) |
|
Mangels, 2009 Germany Mean duration of pain: NR Fair |
A. CPMP + booster sessions (n=119) ~4 weeks + 7, 20-minute booster sessions over 12 months, group + individual, inpatient B. CPMP (n=113) ~4 weeks, group + individual, inpatient C. PA (n=131) ~3.5 weeks, group + individual, inpatient |
Mean age: 49 years % Male: 22% Race/Ethnicity: NR Pain etiology/type Dorsalgia: 84% Other dorsopathies, 71% Arthrosis: 34% Disability: NR Comorbidities: NR |
A vs. B vs. C, Mean (SD) PPS - Affective pain perception (14-56) Baseline: 30.9 (9.4) vs. 30.9 (10.4) vs. 29.6 (9.0) Postintervention: 23.4 (9.4) vs. 23.7 (9.2) vs. 22.9 (8.2) A vs. C: difference 0.50 (95% CI −1.69 to 2.69) B vs. C: difference 0.80 (95% CI −1.39 to 2.99) 12 months: 24.1 (9.8) vs. 25.5 (9.9) vs. 25.1 (9.6) A vs. C: difference −0.10 (95% CI −3.50 to 1.50) B vs. C: difference 0.40 (95% CI −2.14 to 2.94) PPS - Sensory pain perception (10-40) Baseline: 18.9 (5.9) vs. 18.5 (5.6) vs. 18.8 (5.9) Postintervention: 15.9 (5.3) vs. 15.9 (5.2) vs. 16.4 (5.8) A vs. C: difference −0.50 (95% CI −1.89 to 0.89) B vs. C: difference −0.50 (95% CI −1.90 to 0.90) Long term: 16.3 (5.7) vs. 17.0 (6.1) vs. 17.3 (6.1) A vs. C: difference −1.0 (95% CI −2.53 to 0.53) B vs. C: difference −0.30 (95% CI −1.89 to 1.29) PDI (0-70) Baseline: 26.9 (13.9) vs. 26.1 (11.8) vs. 24.8 (12.5) Postintervention: 21.7 (13.3) vs. 20.3 (13.9) vs. 21.0 (13.1) A vs. C: difference 0.70 (95% CI −2.59 to 3.99) B vs. C: difference −0.70 (95% CI −4.12 to 2.71) Long term: 22.6 (16.0) vs. 22.0 (14.0) vs. 20.6 (13.5) A vs. C: difference 2.0 (95% CI −1.80 to 5.80) B vs. C: difference 1.4 (95% CI −2.19 to 4.99) |
A vs. B vs. C, Mean (SD) SF-12 PCS (0-100) Baseline: 33.5 (9.1) vs. 33.6 (7.4) vs. 33.9 (8.7) Postintervention: 38.9 (9.4) vs. 39.3 (9.9) vs. 38.6 (8.6) A vs. C: difference 0.30 (95% CI −1.94 to 2.54) B vs. C: difference 0.70 (95% CI −1.63 to 3.03) Long term: 38.4 (10.4) vs. 38.4 (9.7) vs. 38.4 (10.1) A vs. C: difference 0 (95% CI −2.64 to 2.64) B vs. C: difference 0 (95% CI −2.59 to 2.59) SF-12 MCS (0-100) Baseline: 43.9 (12.1) vs. 44.0 (11.1) vs. 44.5 (11.5) Postintervention: 48.9 (12.1) vs. 50.8 (10.5) vs. 50.9 (10.5) A vs. C: difference −2.0 (95% CI −4.82 to 0.82) B vs. C: difference −0.10 (95% CI −2.76 to 2.56) Long term: 45.6 (11.7) vs. 46.0 (11.2) vs. 45.0 (11.7) A vs. C: difference 0.60 (95% CI −2.42 to 3.62) B vs. C: difference 1.0 (95% CI – 2.00 to 4.00) BDI (0-63) Baseline: 11.4 (9.8) vs. 11.1 (10.1) vs. 10.1 (8.1) Postintervention: 7.2 (7.8) vs. 6.7 (6.0) vs. 7.8 (7.8) A vs. C: difference −0.60 (95% CI −4.08 to 2.88) B vs. C: difference −1.10 (95% CI −4.56 to 2.36) Long term: 10.7 (8.8) vs. 10.4 (7.8) vs.11.4 (8.2) A vs. C: difference −0.70 (95% CI −2.89 to 1.49) B vs. C: difference −1.0 (95% CI – 3.09 to 1.09) |
A vs. B vs. C, Mean (SD) Harms: One death during inpatient treatment (group A); no other details provided German Life Satisfaction (with health) Questionnaire (scale NR) Baseline: 28.4 (9.5) vs. 28.1 (9.0) vs. 28.9 (8.5) Postintervention: 33.1 (8.8) vs. 33.1 (9.2) vs. 32.5 (8.8) A vs. C: 0.60 (95% CI −1.60 to 2.80) B vs. C: 0.60 (95% CI −1.67 to 2.87) Long term: 33.3 (9.5) vs. 31.7 (9.8) vs. 31.2 (8.4) A vs. C: difference 2.1 (95% CI −0.21 to 4.41) B vs. C: difference 0.50 (95% CI −1.87 to 2.87) |
|
Meyer, 2005 Switzerland Mean duration of pain: 36 months Fair |
A. CPMP (n=17) 8 weeks (17.5 hours/week, 140 hours total), session format NR for physical component, individual + group for psychological component, setting NR B. PA (n=16) 8 weeks 1.5 hours/week (12 hours total), session format NR, outpatient |
Median age: 43 years Male: 79% Race/Ethnicity: NR Pain etiology/type: Cervical, arm, and or head: 15% Knee: 3% Back and or leg: 69% Widespread areas: 9% Comorbidities: 1 or more, 39% Other characteristics: To be included, patients needed to have Sick-leave for at least 2 months or 50% work incapacity from a full-time job over 3 months |
A vs. B, Median (IQR) Pain, NRS (0-10) Baseline: 6.0 (3.5 to 7.0) vs. 5.5 (5.0 to 6.0) Postintervention change score: 1.0 (−1.0 to 2.0) vs. 1.0 (0.0 to 2.0), p=0.34 Baseline: 82.0 (58.5 to 124.5) vs. 136.5 (74.8 to 160.8) Postintervention change score: 10.0 (−9.0 to 37.0) vs. 3.0 (−10.0 to 36.0), p=0.60 |
A vs. B, Median (IQR) Baseline: 32.0 (26.7 to 44.0) vs. 29.6 (25.2 to 37.4) Postintervention change score: 6.0 (−5.4 to 12.9) vs. 2.5 (−3.6 to 11.9), p=0.90 Baseline: 30.0 (25.5 to 34.5) vs. 32.8 (28.4 to 37.4) Postintervention change score: −0.4 (−3.8 to 2.6) vs. −4.4 (−9.0 to 0.4), p=0.17 |
A vs. B, % (n/N) Harms
|
|
Roche, 2007, Roche-LeBoucher 2011 France Mean duration of pain: NR (≥3 months) Fair |
A. CPMP (n=68) 5 weeks (6 hours/day, 150 hours total), group, outpatient B. PA (n=64) 5 weeks (5 hours/week, ~25 hours total), individual, outpatient + home setting |
Mean age: 40 years % Male: 65% Race/ethnicity: NR Pain etiology/type: Chronic LBP Disability:
|
A vs. B, Mean (SD) VAS pain (0-10) Baseline: 4.7 (2.1) vs. 4.5 (2.1) Postintervention change score: −1.9 (NR) vs. −1.5 (NR) Long term change score: −1.7 (2.6) vs. −1.0 (2.3), difference in change scores −0.70 (95% CI −1.64 to 0.24) DPQ, daily activities (0%-100%) Baseline: 51.8% (NR) vs. 51.0% (NR) Postintervention change score: −21.5% (NR) vs. −17.2% (NR) Long term change score: −20.3% (18.1%) vs. −10.4% (23.3%), difference in change scores −9.9 (95% CI −17.62 to −2.19) |
A vs. B DPQ, anxiety and depression (0%-100%) Baseline: 36.9% (NR) vs. 30.9% (NR) Postintervention change score: −17.6% (NR) vs. −7.4% (NR) Long term change score: −15.6% (21.4%) vs. −4.8% (23.5%), difference in change scores −10.8 (95% CI −19.20 to −2.40) | Harms: one right tibial fracture in Group A which occurred at home; no other details provided |
|
Ronzi, 2017 France Mean duration of pain: NR (≥3 months) Poor |
A. CPMP (n=49) 5 weeks (30 hours/week; 150 hours total), group + individual, inpatient B. CPMP (n=56) 5 weeks (11 hours/week; 55 hours total), group + individual, outpatient C. PA (n=54) Duration: 5 weeks (~5 hours/week, ~25 hours total), individual, outpatient + home setting |
Mean age: 42 years % Male: 59% Race/ethnicity: NR Pain etiology/type: Chronic LBP Disability: NR Other characteristics: NR |
A vs. B vs. C, Median (IQR) VAS pain (0-100) Baseline: 54 (45 to 65) vs. 55 (36 to 68) vs. 45 (24 to 65) Long term: 45 (25 to 59) vs. 37 (15 to 61) vs. 33 (19 to 48) DPQ, daily activities (0%-100%) Baseline: 63.0% (51.0% to 72.0%) vs. 57.0% (48.0% to 66.0%) vs. 54.0% (48.0% to 69.0%) Long term: 51.0% (12.0% to 64.5%) vs. 39.0% (24.0% to 57.0%) vs. 54.0% (36.0% to 63.0%) |
A vs. B vs. C, Median (IQR) HADS (0-100) Baseline: 17.0 (12.0 to 21.0) vs. 14.0 (11.0 to 18.0) vs. 16.0 (12.0 to 21.0) Long term 11.5 (7.5 to 18.0) vs. 12.0 (7.0 to 15.0) vs. 13.0 (8.0 to 19.0) A vs. C and B vs. C, p=ns DPQ, anxiety and depression (0%-100%) Baseline: 45.0% (20.0% to 60.0%) vs. 35.0% (25.0% to 45.0%) vs. 40.0% (15.0% to 55.0%) Long term: 30.0% (5.0% to 45.0%) vs. 25.0% (5.0% to 45.0%) vs. 30.0% (5.0% to 45.0%) Baseline: 35.7 (29.4 to 39.5) vs. 34.5 (30.7 to 39.2) vs. 35.6 (31.9 to 37.2) Long term: 39.1 (33.8 to 50.4) vs. 41.6 (34.2 to 49.9) vs. 37.5 (33.0 46.8) A vs. C and B vs. C, p=ns Baseline: 43.3 (32.1 to 49.8) vs. 43.4 (35.9 to 51.1) vs. 41.2 (36.1 to 50.8) Long term: 48.3 (42.1 to 53.4) vs. 46.6 (38.7 to 56.6) vs. 48.9 (41.4 to 54.8) A vs. C and B vs. C, p=ns | Harms: No adverse effect related to the interventions was reported |
|
Schweikert, 2006 Germany Mean duration of pain: NR (≥6 months) Fair |
A. CPMP (n=200) 3 weeks hours total NR), group, inpatient B. PA (n=209) 3 weeks hours total NR), group + individual, inpatient |
Mean age: 47 years Male: 83% Race/Ethnicity: NR Pain etiology/type: Chronic LBP Disability:
|
A vs. B, Mean (SD) Back pain (scale 1-6) Baseline: 4.3 (1.3) vs. 4.5 (1.2) Postintervention change score: −1.2 (1.2) vs. −1.2 (1.2), difference in change scores 0 (95% CI −0.25 to 0.25) Hannover functional questionnaire (FFbH) (0-100) Baseline: 76.0 (19.2) vs. 72.2 (18.3) Postintervention change score: 2.8 (12.3) vs. 3.5 (13.4), difference in change scores −0.70 (95% CI −3.37 to 1.97) |
A vs. B, Mean (SD) Depression (0-48) Baseline: 8.3 (7.3) vs. 7.4 (6.3) Postintervention change score: −2.3 (4.7) vs. −1.6 (4.2), difference in change scores −0.70 (95% CI −1.62 to 0.22) STAI (20-80) Baseline: 39.2 (10.4) vs. 38.8 (9.9) Postintervention change score: −2.7 (6.9) vs. −2.3 (6.3), difference in change scores −0.40 (95% CI −1.78 to 0.98) EQ-5D HRQOL (0-100) Baseline: 60.8 (17.6) vs. 59.3 (16.6) Postintervention: 70.3 (19.3) vs. 68.6 (19.5), difference 1.7 (95% CI −2.21 to 5.61) Intermediate term: 70.0 (17.7) vs. 63.8 (19.9), difference 6.2 (95% CI 2.39 to 10.01) | NR |
|
Smeets, 2006a, 2008 Netherlands Mean duration of pain: 56.7 months Cluster RCT Fair |
A. CPMP (n=61) 10 weeks (~75 hours total), group + individual, outpatient B. PA (n=53) 10 weeks (~75 hours total), group + individual, outpatient |
Mean age 42 years Male: 53% Race/ethnicity: NR Mean duration of functional limitations: 35.1 months Pain etiology/type: Chronic LBP
Disability pension:
Trauma preceding LBP: 18% |
A vs. B adjusted mean change score (SD) from baseline VAS, current pain (0-10) Baseline: 4.60 (2.40) vs. 5.12 (2.66) Postintervention: adjusted difference in change scores: −0.018 (95% CI −0.934 to 0.899) Intermediate term: adjusted difference in change scores: 0.498 (95% CI −0.429 to 1.425) Long term: adjusted difference in change scores: 0.804 (95% CI −0.123 to 1.731) Pain Rating Index Total (MPQ) (scale NR) Baseline: 18.08 (9.04) vs. 18.34 (11.32) Postintervention: adjusted difference in change scores: −0.95 (95% CI −4.59 to 2.98) Intermediate term: adjusted difference in change scores: 1.97 (95% CI −1.71 to 5.65) Long term: adjusted difference in change scores: 2.64 (95% CI −1.04 to 6.32) RMDQ (0-23) Baseline (mean, SD): 13.51 (3.92) vs. 14.15 (3.70)) Postintervention: adjusted difference in change scores: −0.05 (95% CI −1.71 to 1.62) Intermediate term: adjusted difference in change scores: 0.62 (95% CI −1.06 to 2.30) Long term: adjusted difference in change scores: 1.16 (–0.52 to 2.84) VAS, main (activity) complaints (0-10) Baseline: 7.24 (1.70) vs. 7.45 Postintervention: adjusted difference in change scores: −0.64 (95% CI −1.60 to 0.33) Intermediate term: adjusted difference in change scores: −0.23 (95% CI −1.19 to 0.74) Long term: adjusted difference in change scores: 0.03 (95% CI −0.94 to 1.00) |
A vs. B adjusted mean change score (SD) from baseline BDI (0-63) Baseline: 9.75 (6.68) vs. 10.38 (7.62) Postintervention: adjusted difference in change scores: 2.17 (95% CI 0.18 to 4.17) Intermediate term: adjusted difference in change scores for group: 0.49 (95% CI −1.54 to 2.51) Long term: adjusted difference in change scores: 1.05 (95% CI −0.97 to 3.07) Global Improvement (1-7) Postintervention: adjusted difference in change scores: 0.20 (95% CI – 0.35 to 0.75) Intermediate term: adjusted difference in change scores: −0.38 (95% CI −0.94 to 0.18) Long term: adjusted difference in change scores: −0.61 (95% CI −1.16 to −0.05) |
A vs. B, % (n/N) or mean (SD) Harms:
(effect modification by RMDQ) p=NS between groups except for in the 90th percentile strata of RMDQ. Postintervention: adjusted difference: −21.58 (95% CI −39.56 to −3.59) |
|
Turner, 1990 USA Mean duration of pain: 12.9 years Poor |
A. CPMP (n=18) 8 weeks (4 hours/week, 32 hours total), group and individual, outpatient B. PA (n=21) 8 weeks (2 hours/week, 16 hours total). group + individual, outpatient |
Mean age: 44 years Male: 52.1% Race/ethnicity: White: 100% Pain etiology/type: Chronic LBP Disability: N/A |
A vs. B, Mean (SD) MPQ Pain Rating Index (0-78) Baseline: 25.5 (12.41) vs. 19.4 (10.6) Postintervention: 14.78 (11.44) vs. 17.51 (10.2), difference −2.73 (95% CI −9.75 to 4.29) Intermediate term: 13.29 (9.15) vs.15.65 (9.15), difference −2.36 (95% CI −8.32 to 3.60) Long term: 18.21 (13.31) vs. 14.94 (7.86), difference 3.27 (95% CI −3.70 to 10.24) SIP (0-100) Baseline: 8.50 (4.59) vs. 8.42 (8.21) Postintervention: 3.63 (2.98) vs. 5.49 (6.79), difference −1.86 (95% CI −5.36 to 1.64) Intermediate term: 4.51 (4.68) vs. 6.25 (10.08), difference −1.74 (95% CI −6.99 to 3.51) Long term: 4.75 (3.40) vs. 4.73 (7.85) difference 0.02 (95% CI −4.02 to 4.06) |
A vs. B, Mean (SD) CES-D (0-60) Baseline: 12.38 (7.31) vs. 11.95 (7.68) Postintervention: 7.36 (5.89) vs. 7.38 (4.57), difference −0.02 (95% CI −3.42 to 3.38) Intermediate term: 8.29 (7.94) vs. 9.29 (8.30), difference −1.0 (95% CI −6.30 to 4.30) Long term: 10.00 (7.57) vs. 9.31 (7.73), difference 0.69 (95% CI – 4.29 to 5.67) |
A vs. B, Mean (SD) Harms: NR Patient satisfaction (1-7): Postintervention: 5.50 (NR) vs. 4.48 (NR), p=NS |
|
van Eijk-Hustings, 2013, 2016 Netherlands Mean duration of pain: 6.8 years Fair |
A. CPMP (n=108) 12 weeks (36 days of sessions), group, outpatient B. PA (n=47) 12 weeks (24 sessions), group, outpatient |
Mean age 42 years Male: 4% Race/Ethnicity: NR Pain etiology/type: FM Disability: NR |
Estimated marginal means (SD), A vs. B FIQ, Pain Baseline: 6.3 (2.1) vs. 6.2 (1.8) Postintervention: 5.5 (2.1) vs. 5.3 (2.1), difference 0.20 (95% CI −0.53 to 0.93 Long term: 5.3 (2.1) vs. 5.2 (2.5) difference 0.10 (95% CI −0.67 to 0.87) FIQ Total Baseline: 64.5 (14.6) vs. 60.0 (14.4) Postintervention: 55.1 (15.6) vs. 53.2 (16.5), difference 1.90 (95% CI −3.58 to 7.38 Long term: 50.9 (20.8) vs. 52.0 (21.9), difference −1.1 (95% CI −8.40 to 6.20) |
Estimated marginal means (SD), A vs. B EQ-5D (scale −0.59 to 1) Baseline: 0.36 (0.3) vs. 0.41 (0.3) Postintervention): 0.49 (0.3) vs. 0.47 (0.3), difference 0.02 (95% CI −0.08 to 0.12 Long term: 0.55 (0.3) vs. 0.54 (0.3), difference 0.01 (95% CI −0.09 to 0.11 FIQ, Depression Baseline: 5.2 (3.1) vs. 4.8 (2.1) Postintervention: 4.1 (3.1) vs. 4.6 (2.7), difference −0.50 (95% CI −1.53 to 0.53 Long term: 3.9 (3.1) vs. 5.0 (3.4), difference −1.1 (95% CI −2.20 to 0.002) FIQ, Anxiety Baseline: 5.9 (3.1) vs. 4.9 (2.1) Postintervention: 5.0 (2.1) vs. 4.6 (2.7), difference 0.40 (95% CI −0.39 to 1.19 Long term: 4.7 (3.1) vs. 5.0 (3.4), difference −0.30 (95% CI −1.40 to 0.80 |
Estimated marginal means (SD), A vs. B Harms: NR A vs. B Contact with GPs a Baseline: 2.3 (3.1) vs. 3.3 (5.5) Long term: 0.9 (2.1) vs. 0.7 (2.1), difference 0.20 (95% CI −0.53 to 0.93 Contact with medical specialists a Baseline: 1.9 (1.0) vs. 1.9 (1.4) Long term: 0.3 (1.0) vs. 0.4 (0.7), difference – 0.10 (95% CI −0.42 to 0.22 Contact with physiotherapists a Baseline: 2.7 (5.2) vs. 1.9 (1.4) Long term: 2.6 (5.2) vs. 0.4 (0.7) difference 2.20 (95% CI 0.69 to 3.71) Contact with other paramedical professionals a Baseline: 1.1 (3.1) vs. 1.1 (2.7) Long term: 1.0 (3.1) vs. 2.1 (3.4), difference – 1.10 (95% CI −2.20 to 0.002) |
BDI = Beck Depression Inventory; CES-D = Center for Epidemiological Studies Depression; CI = confidence interval; CPMP = comprehensive pain management program; EQ-5D = EuroQol 5Dimensions; FIQ = Fibromyalgia Impact Questionnaire; FM = fibromyalgia; HADS = Hospital Anxiety and Depression Scale; HRQOL = health-related quality of life; IP = Inpatient; LBP = low back pain; MCS = Mental component summary score (of the SF-12 or SF-36); MVAS = Million visual analog scale; NR = not reported; NS = not statistically significant; ODI = Oswestry Disability Index; OP = outpatient; PA = physical activity; PACT = Performance Assessment of Capacity Testing; PCS = Physical component summary score (of the SF-12 or SF-36); PDI = Pain Disability Index; PPS = Pain Perception Scale; RCT = randomized controlled trial; SIP = Sickness Impact Profile; SD = standard deviation; SF-36 = Short-Form 36 questionnaire; STAI = State-Trait Anxiety Inventory; VAS = visual analog scale
- a
Total number of consultations over a period of 2 months prior to measurement
Table B-7Summary results for trials addressing KQ1: CPMPs versus pharmacologic therapy alone
|
Author, Year Country Pain Duration Study Design Study Quality | Intervention (n), Comparator (n), Duration/Intensity, Session Format, Setting | Population |
Primary Outcomes: Pain, Function, and Opioid Use |
Secondary Outcomes: HRQOL, Psychological Measures, Global Improvement |
Harms Utilization Patient Satisfaction |
|---|---|---|---|---|---|
|
Castel, 2013, 2015, Salvat, 2017 Spain Mean pain duration: 140 months Fair |
A. Comprehensive pain management program (n=74) 12 weeks, 4 hours/week, 48 hours total, group, outpatient B. Pharmacological therapy only (n=81) 12 weeks, Analgesics, antidepressants, benzodiazepine and nonbenzodiazepine hypnotics (dosages NR); adjusted as recommend by guidelines |
Mean age: 49 years % Female: 100% Race/Ethnicity: NR Pain etiology/type: Fibromyalgia Disability: NR
Comorbidities: NR |
A vs. B, Mean (SD) (unless otherwise stated) Proportion of patients meeting the MCID of 30% improvement on the NRS, % (n’s and N’s NR) Posttreatment: 22.2% (18/81) vs. 6.7% (5/74), RR 3.3 (95% CI 1.3 to 8.4) Short term: 13.6% (11/81) vs. 10.8% (8/74), RR 1.3 (95% CI 0.53 to 3.0) Intermediate term: 16.0% (13/81) vs. 5.4% (4/74), RR 3.0 (95% CI 1.0 to 8.7) Long term: 8.6% (7/81) vs. 0% (0/74), RR not calculable Pain NRS (0 to 10) Baseline: 6.8 (1.4) vs. 7.1 (1.6) Posttreatment: 5.7 (1.9) vs. 6.9 (1.8), difference −1.2 (95% CI −7.8 to −0.61) Short term: 6.4 (1.9) vs. 6.8 (1.8), difference −0.40 (95% CI −0.99 to 0.19) Intermediate term: 6.4 (1.9) vs. 7.0 (1.9), difference −0.60 (95% CI −1.2 to 0.00) Long term: 6.7 (1.6) vs. 7.1 (1.8), difference −0.40 (95% CI −0.94 to 0.14) Proportion of patients meeting the MCID of 14% improvement on the FIQ, % (n/N) Posttreatment: 64.2% (52/81) vs. 24.3% (18/74), RR 2.6 (95% CI 1.7 to 4.1) Short term: 48.1% (39/81) vs. 23.0% (17/74), RR 2.1 (95% CI 1.3 to 3.4) Intermediate term: 42.0% (34/81) vs. 18.9% (14/74), RR 2.2 (95% CI 1.3 to 3.8) Long term: 27.2% (22/81) vs. 4.0% (3/74), RR 6.7 (95% CI 2.1 to 21.5) FIQ (0 to 100) Baseline: 64.6 (16.0) vs. 66.6 (17.4) Posttreatment: 47.7 (20.2) vs. 65.9 (16.1), difference −18.2 (95% CI −24.0 to −12.4) Short term: 55.5 (19.3) vs. 64.6 (17.6), difference −9.1 (95% CI −15.0 to −3.2) Intermediate term: 55.8 (20.9) vs. 67.8 (18.4), difference −12.0 (95% CI −18.3 to −5.7) Long term: 58.8 (20.5) vs. 69.6 (17.2), difference −10.8 (95% CI −16.8 to −4.8) COOP/WANCA physical function subscale (0 to 5) Baseline: 3.0 (0.84) vs. 3.3 (0.77) Posttreatment: 2.4 (0.76) vs. 3.3 (0.72), difference −0.90 (95% CI −1.1 to −0.65) Short term: 2.7 (1.2) vs. 3.2 (0.61), difference −0.50 (95% CI −0.84 to −0.16) Intermediate term: 2.7 (0.74) vs. 3.4 (0.91), difference −0.70 (95% CI −0.99 to −0.41) Long term: 2.7 (0.86) vs. 3.3 (0.57), difference −0.60 (95% CI −0.93 to – 0.27) COOP/WANCA daily activities subscale (1 to 5) Baseline: 3.3 (0.47) vs. 3.4 (0.43) Posttreatment: 2.8 (0.43) vs. 3.1 (0.40), difference −0.30 (95% CI −0.44 to −0.16) Short term: 2.9 (0.43) vs. 3.2 (0.61), difference −0.30 (95% CI −0.48 to −0.12) Intermediate term: 3.0 (0.42) vs. 3.3 (0.58), difference −0.30 (95% CI −0.47 to −0.12) Long term: 2.9 (0.55) vs. 3.3 (0.57), difference −0.40 (95% CI −0.64 to – 0.16) Authors found no significant interactions in BMI × time, and in BMI × group treatment × time. There are not differences among normal weight, overweight, and obese patients with FM regarding their response to a CPMP for any of the outcomes listed above. |
A vs. B, Mean (SD) COOP/WANCA measure of HRQOL (9-45) Baseline: 26.8 (32.9) vs. 28.0 (27.7) Posttreatment: 22.1 (29.7) vs. 26.7 (28.0), difference −5.9 (95% CI −16.0 to 4.2) Short term: 23.8 (29.7) vs. 26.5 (28.0), difference −2.7 (95% CI −12.8 to 7.3) Intermediate term: 23.7 (28.9) vs. 27.3 (26.6), difference −3.6 (95% CI −13.5 to 6.2) Long term: 23.4 (25.1) vs. 26.5 (21.9), difference −3.1 (95% CI −13.4 to 7.2) Baseline: 21.9 (8.0) vs. 23.2 (8.1) Posttreatment: 14.3 (9.0) vs. 21.7 (8.4), difference −7.4 (95% CI −10.2 to −4.6) Short term: 15.2 (9.1) vs. 20.6 (8.5), difference −5.4 (95% CI −8.2 to −2.6) Intermediate term: 16.2 (9.3) vs. 21.5 (8.5), difference −5.3 (95% CI −8.1 to −2.5) Long term: 17.1 (9.9) vs. 22.8 (9.2), difference −5.7 (95% CI −8.7 to −2.7) Authors found no significant interactions in BMI × time, and in BMI × group treatment × time. There are not differences among normal weight, overweight, and obese patients with FM regarding their response to a CPMP for any of the outcomes listed above. | NR |
|
Martin, 2014a, 2014b, 2014c Spain Mean duration of pain: 170 months Poor |
A. Comprehensive pain management program (n=54) 6 weeks, 2.75 hours/week, 16.5 hours total, session format NR, outpatient B. Pharmacological therapy only (n=56) 6 weeks, Amitriptyline (maximum dose 75 mg/day), Paracetamol, (maximum dose 4 g/day), Tramadol, (maximum dose 400 mg/day) |
Mean age: 50 years % Male: 9% Race/Ethnicity: NR Pain etiology/type: Fibromyalgia Disability: 15% Comorbidities:
|
A vs. B, Mean (SD) VAS current pain (0 to 10) Baseline: 6.76 (1.98) vs. 7.06 (2.04) Intermediate term: 5.99 (2.37) vs. 7.21 (1.56), difference −1.2 (95% CI −2.0 to – 0.46) FIQ Total (0 to 100) Baseline: 76.28 (13.17) vs. 76.23 (14.80) Intermediate term: 70.33 (16.98) vs. 76.81 (14.18), difference −6.5 (95% CI −12.4 to −0.58) |
A vs. B, Mean (SD) FIQ depression subscale (0 to 10) Baseline: 6.90 (3.06) vs. 7.20 (2.83) Intermediate term: 6.44 (3.13) vs. 6.61 (3.14), difference −0.17 (95% CI −1.4 to 1.0) HADS depression (0 to 21) Baseline: 10.63 (4.57) vs. 10.57 (4.06) Intermediate term: 9.77 (4.09) vs. 10.25 (4.22), difference −0.48 (95% CI −2.1 to 1.1) HADS anxiety (0 to 21) Baseline: 13.13 (3.39) vs. 13.39 (3.45) Intermediate term: 13.49 (4.31) vs. 12.75 (4.55), difference 0.74 (95% CI −0.94 to 2.4) | NR |
|
Onac, 2012, 2017 Romania Mean duration of pain: NR Poor |
A. Comprehensive pain management program (n=29) 2 weeks, 5 days/week (total hours NR), individual, inpatient B. Pharmacological therapy (n=20) 2 weeks, Diclofenac (50mg, 3 times/day), Omeprazole (20 mg, 1 time/day), and Acetaminophen (1000 mg, 4 times/day) |
Population data include patients from the third arm of this trial Mean age: 47 years % Male: 57% Race/ethnicity: NR Pain etiology/type: Lumbar disk hernia Disability: NR Other characteristics:
|
A vs. B Mean (SD) VAS pain (0 to 10) All patients Baseline: 3.83 (1.89) vs. 5.77 (2.55) Postintervention (2 weeks): 3.02 (1.94) vs. 4.73 (2.67), difference −1.71 (95% CI −3.0 to −0.39) Nonclinical catastrophizers Baseline: 3.12 (1.70) vs. 4.67 (2.56) Postintervention (2 weeks): 1.78 (1.14) vs. 3.65 (2.44), difference −1.87 (95% CI −3.3 to −0.45) Clinical catastrophizers Baseline: 4.32 (2.00) vs. 7.80 (1.39) Postintervention (2 weeks): 3.77 (1.91) vs. 6.60 (2.45), difference −2.83 (95% CI −4.8 to −0.83) RMDQ (0 to 24) All patients Baseline: 10.66 (6.73) vs. 9.95 (5.75) Postintervention (2 weeks): 8.66 (7.11) vs. 8.90 (6.406), difference −0.24 (95% CI −4.2 to 3.8) |
A vs. B Mean (SD) POMS-SV Emotional Distress (scale NR) All patients Baseline: 46.03 (26.52) vs. 39.85 (21.52) Postintervention (2 weeks): 43.15 (31.16) vs. 37.94 (21.01), difference 5.2 (95% CI −10.9 to 21.3) | NR |
|
Tavafian, 2011, 2014, 2017a, 2017b Iran Mean duration of pain: 82.2 months Fair |
A. Comprehensive pain management program (n=97) 1 week + monthly booster sessions, 69 hours total, session format NR, outpatient B. Pharmacologic therapy alone (n=100) Analgesics, NSAIDS, muscle relaxants, and antidepressant drugs |
Mean age: 45 years % Male: 26.08% Race/ethnicity: NR Pain etiology/type: Chronic LBP Disability: NR Comorbidities:
|
A vs. B, Mean (SD) QDS (0 to 100) Baseline: 35.45 (20.19) vs. 33.08 (19.69) Short term: 23.48 (18.54) vs. 32.70 (18.19), difference −9.2 (95% CI −14.5 to −3.9) Intermediate term: 18.65 (16.14) vs. 27.19 (17.85), difference −8.5 (95% CI −13.4 to −3.6) Long term (12 months): 17.4 (16.4) vs. 24.4 (18.3), difference −7.0 (95% CI – 12.1 to −1.9) Long term (18 months): 17.56 (15.62) vs. 23.80 (18.53), difference −6.2 (95% CI −11.9 to −0.60) Long term (24 months): 15.36 (16.22) vs. 23.32 (17.74), difference −8.0 (95% CI −13.5 to −2.4) Long term (30 months): 15.85 (16.39) vs. 21.41 (17.21), difference −5.6 (95% CI −11.1 to −0.05) RMDQ (0 to 24) Baseline: 9.80 (5.07) vs. 10.04 (5.28) Short term: 9.01 (5.71) vs. 10.56 (5.78), difference −1.6 (95% CI −3.2 to 0.10) Intermediate term: 7.03 (5.49) vs. 8.80 (5.68), difference −1.8 (95% CI −3.4 to −0.17) Long term (12 months): 6.01 (5.8) vs. 8.9 (6.6), difference −2.89 (95% CI −4.5 to −1.2) Long term (18 months): 5.86 (5.62) vs. 8.97 (6.54), difference −3.1 (95% CI −5.1 to −1.1) Long term (24 months): 5.62 (5.89) vs. 7.88 (5.90), difference −2.3 (95% CI −4.2 to −0.33) Long term (30 months): 5.52 (5.89) vs. 7.71 (6.35), difference −2.2 (95% CI – 4.2 to −0.18) |
A vs. B, Mean (SD) SF-36, Physical function (0 to 100) a Baseline: 54.61 (23.27) vs. 54.53 (23.30) Short term: 68.64 (23.39) vs. 60.93 (22.04), difference 7.7 (95% CI 1.2 to 14.3) Intermediate term: 77.77 (18.71) vs. 63.698 (21.88), difference 14.1 (95% CI 8.2 to 19.9) Long term (12 months): 80.3 (18.6) vs. 64.4 (22.8), difference 15.9 (95% CI 9.7 to 22.1) SF-36, Role physical (0 to 100) a Baseline: 30.70 (33.98) vs. 32.81 (36.86) Short term: 57.88 (68.33) vs. 39.58 (36.93), difference 18.3 (95% CI 2.6 to 34.0) Intermediate term: 66.03 (36.79) vs. 47.13 (39.04), difference 18.9 (95% CI 8.0 to 29.8) Long term (12 months): 72.4 (37.3) vs. 56.04 (38.3), difference 16.3 (95% CI 5.2 to 27.6) SF-36, Bodily pain (0 to 100) a Baseline: 43.27 (22.59) vs. 47.45 (23.59) Short term: 65.82 (22.56) vs. 56.35 (23.62), difference 9.5 (95% CI 2.8 to 16.1) Intermediate term: 72.34 (22.77) vs. 60.27 (25.82), difference 12.1 (95% CI 5.1 to 19.1) Long term (12 months): 69.5 (18.3) vs. 56.2 (21.3), difference 13.3 (95% CI 7.4 to 19.2) SF-36, General health (0 to 100) a Baseline: 50.41 (20.16) vs. 49.92 (19.80) Short term: 59.67 (21.59) vs. 52.65 (23.34), difference 7.0 (95% CI 0.69 to 13.3) Intermediate term: 61.01 (21.96) vs. 53.29 (22.83), difference 7.7 (95% CI 1.3 to 14.2) Long term (12 months): 69.6 (21.7) vs. 59.9 (24.3), difference 9.7 (95% CI 2.9 to 16.5) Baseline: 53.58 (19.22) vs. 53.95 (20.02) Short term: 60.10 (23.25) vs. 55.05 (20.74), difference 5.1 (95% CI −1.3 to 11.4) Intermediate term: 65.70 (22.25) vs. 59.84 (22.35), difference 5.9 (95% CI −0.56 to 12.3) Long term (12 months): 70.3 (22.5) vs. 63.1 (22.5), difference 7.2 (95% CI 0.54 to 13.9) SF-36, Mental health (0 to 100) a Baseline: 47.43 (13.96) vs. 44.00 (13.10) Short term: 65.13 (21.59) vs. 57.70 (23.22), difference 7.4 (95% CI 0.97 to 13.9) Intermediate term: 66.04 (23.67) vs. 61.41 (23.25), difference 4.6 (95% CI −2.1 to 11.4) Long term (12 months): 71.8 (20.2) vs. 58.9 (24.9), difference 12.9 (95% CI 6.2 to 19.6) SF-36, Role emotional (0 to 100) a Baseline: 38.04 (40.32) vs. 49.65 (44.580) Short term: 50.72 (45.15) vs. 41.31 (44.25), difference 9.4 (95% CI −3.5 to 22.3) Intermediate term: 58.33 (45.99) vs. 52.43 (47.07), difference 5.9 (95% CI −7.5 to 19.3) Long term (12 months): 72.4 (42.3) vs. 53.1 (46.6), difference 19.3 (95% CI 6.1 to 32.5) SF-36, Social Function (0 to 100) a Baseline: 62.22 (24.65) vs. 63.02 (28.55) Short term: 59.78 (21.12) vs. 51.77 (21.20), difference 8.0 (95% CI 1.9 to 14.1) Intermediate term: 76.90 (23.50) vs. 69.37 (26.65), difference 7.5 (95% CI 0.30 to 14.8) Long term (12 months): 81.6 (19.3) vs. 70.05 (27.4), difference 11.6 (95% CI 4.5 to 18.6) | NR |
|
Tavaflan, 2008 Iran Mean duration of pain: 9.07 months Fair |
A. Comprehensive pain management program (n=50) 4 days, intensity NR, individual, outpatient B. Pharmacological therapy alone (n=52) Acetaminophen, NSAID and chlordiazepoxide |
Mean age: 44 years % Female: 100% Race/ethnicity: NR Pain etiology/type: Chronic LBP Disability: NR Comorbidities:
| NR |
A vs. B, Mean (SD) Baseline: 44.3 (16.8) vs. 42.6 (24.0) Short term: 76.7 (17.3) vs. 51.2 (28.1), difference 25.5 (95% CI 14.9 to 36.3) Intermediate term: 66.6 (27.5) vs. 51.2 (28.8), difference 15.4 (95% CI 2.4 to 28.5) Long term: 64.7 (36.3) vs. 51.1 (28.3), difference 13.6 (95% CI −1.5 to 28.7) Baseline: 47.7 (28) vs. 49.5 (23.1) Short term: 80.4 (22.8) vs. 57.4 (29.5), difference 23.0 (95% CI 10.8 to 35.2) Intermediate term: 66.9 (29.9) vs. 57.9 (25.5), difference 9.0 (95% CI −3.9 to 21.9) Long term: 65.1 (27.2) vs. 60.2 (26.6), difference 4.9 (95% CI −7.6 to 17.4) | NR |
BMI = body mass index; CI = confidence interval; COOP/WANCA = Dartmouth Primary Care Cooperative Information Project/World Organization of National Colleges, Academies, and Academic Associations of General Practice/Family Physicians; FIQ = Fibromyalgia Impact Questionnaire; HADS = Hospital Anxiety and Depression Scale; HRQOL = health-related quality of life; LBP = low back pain; MCID = Minimally clinically important difference; MD = mean difference; NR = not reported; NRS = Numeric Rating Scale; NRS = numeric rating scale; NSAIDS = nonsteroidal anti-inflammatory; POMS-SV = Profile of Mood States Short Version; QDS = Quebec Back Pain Disability Scale; QOL = quality of life; RCT = randomized control trial; RMDQ = Roland Morris Disability Questionnaire; RR = risk ratio; SD = standard deviation; SF-36 = short form 36 item questionnaire; VAS = Visual Analog Scale.
- a
Only 12-month data for long term followup are reported here. For long term followup at 18, 24, and 30 months, see the full data abstraction appendix.
Table B-8Summary results for trials addressing KQ1: CPMPs versus pharmacologic therapy plus physical activity
|
Author, Year Country Pain Duration Study Design Study Quality |
Intervention (n) Comparator (n) Duration/Intensity Session Format Setting | Population |
Primary Outcomes: Pain, Function, and Opioid Use |
Secondary Outcomes: HRQOL, Psychological Measures, Global Improvement |
Harms Utilization Patient Satisfaction |
|---|---|---|---|---|---|
|
Thieme 2003 Germany Mean duration of pain: 195.7 months Fair |
A. Comprehensive pain management program (n=42) 5 weeks, 75 hours total, combination of individual and group, inpatient B. Physical Activity + Pharmacological therapy (n=21) 5 weeks, Antidepressants, physical component not well described, mostly passive |
Mean age: 48 years % Male: 0% (female only for inclusion) Race/ethnicity: NR Pain etiology/type: Fibromyalgia Disability: NR Other characteristics:
|
A vs. B, Mean (SD) MPI, Pain intensity (0 to 6) Baseline: 4.43 (0.98) vs. 4.34 (1.11) Postintervention: 3.82 (0.96) vs. 5.47 (1.06), difference −1.7 (95% CI −2.2 to −1.1) Intermediate term: 3.66 (1.22) vs. 4.85 (0.86), difference −1.2 (95% CI −1.8 to −0.59) Long term: 3.18 (1.27) vs. 5.28 (0.83), difference – 2.1 (95% CI −2.7 to −1.5) MPI, Interference (0 to 6) Baseline: 4.35 (1.01) vs. 4.43 (0.91) Postintervention: 3.29 (1.02) vs. 5.28 (0.86), difference −2.0 (95% CI −2.5 to −1.5) Intermediate term: 2.96 (1.18) vs. 4.83 (0.72), difference −1.9 (95% CI −2.4 to −1.3) Long term: 2.79 (1.37) vs. 5.33 (0.81), difference – 2.5 (95% CI −3.2 to −1.9) MPI, Total activity (0 to 6) Baseline: 2.53 (0.78) vs. 2.89 (0.91) Postintervention: 2.65 (0.65) vs. 2.90 (0.92), difference −0.25 (95% CI −0.66 to 0.16) Intermediate term: 2.68 (0.81) vs. 2.90 (0.93), difference −0.22 (95% CI −0.68 to 0.24) Long term: 2.63 (0.70) vs. 2.90 (0.93), difference – 0.27 (95% CI −0.69 to 0.15) |
A vs. B, Mean (SD) MPI, Affective distress (0 to 6) Baseline: 3.69 (1.33) vs. 3.72 (1.57) Postintervention: 2.54 (1.03) vs. 4.46 (1.48), difference −1.9 (95% CI −2.6 to −1.3) Intermediate term: 2.38 (1.29) vs. 4.47 (1.65), difference −2.1 (95% CI −2.9 to −1.3) Long term: 2.46 (1.28) vs. 4.78 (1.60), difference −2.3 (95% CI −3.1 to −1.6) |
A vs. B, mean (SD) Program-related outcomes: Number of doctor visits: Baseline: 31.61 (19.88) vs. 28.60 (18.40) 15 months: 14.70 (9.90) vs. 37.8 (22. 03), difference 3.0 (95% CI −7.4 to 13.5) Number of days at the hospital: Baseline: 13.24 (22.96) vs. 10.35 (14.76) 15 months: 2.61 (6.34) vs. 18.65 (17.82), difference −16.04 (95% CI – 22.3 to −9.8) |
|
Onac, 2012 & 2017 Romania Mean duration of pain: NR Poor |
A. Comprehensive pain management program (n=29) 2 weeks, 5 days/week (total hours NR), individual, inpatient B. Physical Activity + Pharmacological therapy (n=26) 2 weeks (total hours NR), Diclofenac (50mg, 3 times/day), Omeprazole (20 mg, 1 time/day), and Acetaminophen (1000 mg, 4 times/day) physical component not well described, mostly passive |
Population data include patients from the third arm of this trial Mean age: 47 years % Male: 57% Race/ethnicity: NR Pain etiology/type: Lumbar disk hernia Disability: NR Other characteristics: Patients were excluded if they had history of psychotic disorders, substance abuse disorders in past Short term, or certain personality disorders. |
A vs. B, Mean (SD) VAS pain (0 to 10) All patients Baseline: 3.83 (1.89) vs. 4.58 (2.59) Postintervention (2 weeks): 3.02 (1.94) vs. 2.086 (2.17), difference 0.93 (95% CI −0.19 to 2.1) Nonclinical catastrophizers Baseline: 3.12 (1.70) vs. 3.53 (2.47) Postintervention (2 weeks): 1.78 (1.14) vs. 1.52 (1.82), difference 0.26 (95% CI −0.83 to 1.3) Clinical catastrophizers Baseline: 4.32 (2.00) vs. 6.45 (1.60) Postintervention (2 weeks): 3.77 (1.91) vs. 3.07 (2.49), difference 0.70 (95% CI −1.3 to 2.7) RMDQ (0 to 24) All patients Baseline: 10.66 (6.73) vs. 11.16 (5.82) Postintervention (2 weeks): 8.66 (7.11) vs. 7.16 (5.23), difference 1.5 (95% CI −2.0 to 5.0) |
A vs. B, Mean (SD) POMS-SV Emotional Distress (scale NR) All patients Baseline: 46.03 (26.52) vs. 45.16 (28.09) Postintervention (2 weeks): 43.15 (31.16) vs. 41.90 (32.18), difference 1.25 (95% CI −16.1 to 18.6) | NR |
CI = confidence interval; FIQ = Fibromyalgia Impact Questionnaire; HRQOL = health-related quality of life; MD = mean difference; MPI = Multidimensional Pain Inventory; NR = not reported; POMS-SV = Profile of Mood States Short Version; RCT = randomized control trial; RMDQ = Roland Morris Disability Questionnaire; SD = standard deviation; VAS = Visual Analog Scale
Table B-9Summary results for trials addressing KQ1: CPMPs versus psychological therapy
|
Author, Year Country Pain Duration Study Design Study Quality |
Intervention (n) Comparator (n) Duration/Intensity Session Format Setting | Population |
Primary Outcomes: Pain, Function, and Opioid Use |
Secondary Outcomes: HRQOL, Psychological Measures, Global Improvement |
Harms Utilization Patient Satisfaction |
|---|---|---|---|---|---|
|
Jensen, 2001 Sweden Duration of pain: 31 months Fair |
A. Comprehensive pain management program, (n=63): 4 weeks (33-34 hours/week, plus six 90-minute booster sessions over a period of 1 year after treatment); high intensity, group; Rehabilitation clinic B. Psychological Therapy (n=49): 4 weeks, (13-14 hours/week, plus six 90-minute booster sessions over a period of 1 year after treatment); low intensity, group in person; Rehabilitation clinic |
Mean age: 43 years Male: 45% Race/ethnicity: Swedish origin 67% Pain etiology/type: Chronic nonspecific spinal pain
| NR |
A vs. B, Mean (SD) SF-36 Global health (0-100) Females only (n=30 vs. 22) Baseline: 38.1 (14.5) vs. 38.9 (13.7) Postintervention: 47.6 (18.0) vs. 48.8 (16.8) Intermediate term: 52.4 (21.6) vs. 54.2 (19.3) Long term: 53.1 (24.5) vs. 58.2 (18.4)
Males only (n=33 vs. 27) Baseline: 41.6 (14.6) vs. 43.8 (16.0) Postintervention: 48.5 (17.2) vs. 44.8 (18.0) Intermediate term: 54.3 (18.3) vs. 43.5 (19.1)) Long term: 57.2 (21.8) vs. 50.8 (27.9)
|
A vs. B, Mean (SD) Harms: NR Perceived appropriateness of the treatment program to treating patient’s pain (0-10) Females only (n=30 vs. 22) Postintervention: 6.4 (3.1) vs. 4.8 (3.7), p=ns Males only (n=33 vs. 27) Postintervention: 6.0 (3.6) vs. 4.5 (3.2), p=ns Likelihood of recommending treatment program to a relative with a similar pain condition (0-10) Females only (n=30 vs. 22) Postintervention: 7.0 (3.7) vs. 6.0 (3.8), p=ns Males only (n=33 vs. 27) A vs. B Postintervention: 6.1 (4.3) vs. 5.1 (4.2), p=ns |
|
Linton, 2005 Sweden Pain duration: NR (>12 weeks: 84%) Fair |
A. Comprehensive pain management program, (n=69): 6 weeks (hours not reported, at least 12 total); low intensity, group; Primary care (outpatient) B. Psychological Therapy (n=47): 6 weeks, (2 hour session); low intensity, group; outpatient |
Mean age: 48 years Male: 16% Race/ethnicity: NR Pain etiology/type:
Comorbidities: NR |
A vs. B, Mean (SD) Pain Numeric Rating Scale (0-10) Average pain last week: Baseline: 4.4 (2.1) vs. 4.2 (2.5) Long term: 2.9 (2.2) vs. 3.4 (2.4); difference −0.5 (95% CI −1.35 to 0.35) Average pain last 3 months: Baseline: 4.5 (1.9) vs. 4.5 (2.1) Long term: 3.0 (1.8) vs. 3.2 (2.4); difference −0.2 (95% CI −0.98 to 0.58) Worst pain last 3 months: Baseline: 6.0 (2.3) vs. 5.6 (2.5) Long term: 4.3 (2.9) vs. 4.5 (3); difference −0.2 (95% CI −1.29 to 0.89) Pain-free days in last week (0-7) Baseline: 2.3 (2.5) vs. 1.9 (3.0) Long term: 3.5 (3.0) vs. 3.2 (3); difference 0.3 (95% CI −0.81 to 1.41) Activities of Daily Living (0-50) Baseline: 38.9 (10.0) vs. 38.9 (12.3) Long term: 41.5 (10.4) vs. 42.6 (7.9); difference −1.10 (95% CI – 4.55 to 2.35) RMDQ (0-18) Baseline: 3.7 (4.5) vs. 3.4 (5.1) Long term: 3.4 (4.2) vs. 3.2 (4.1); difference 0.2 (95% CI −1.33 to 1.74) |
A vs. B, Mean (SD) HADS Anxiety (0-21) Baseline: 4.9 (3.8) vs. 5.3 (5.1) Long term: 5.2 (3.6) vs. 5.1 (4.3); difference 0.10 (95% CI −1.36 to 1.56) HADS Depression (0-21) Baseline: 3.8 (1.27) vs. 4.1 (4.0) Long term: 3.8 (3.6) vs. 4.0 (4.5): difference −0.20 (95% CI −1.70 to 1.30) |
A vs. B, Mean (SD) Number of health care visits for spinal pain during the past year 12 months before treatment: 2 vs. 1.5 Long term: 1.25 vs. 2.5, p=0.06 |
|
Smeets, 2006a, 2008 Netherlands Pain duration: 56.7 months Fair |
A. Comprehensive pain management program (n=61): 10 weeks (79 hours total), low intensity, group and individual, outdoor rehabilitation centers B. Psychological Therapy only (CBT) only (n=58): 10 weeks (26.5 hours total), low intensity, group and individual, rehabilitation center |
Mean age: 42 years Male: 53% Race/ethnicity: NR Pain etiology/type: Pain etiology/type: LBP
Disability: Full sick leave/disability pension: 38% Partial sick leave/disability pension: 24% Comorbidities: NR |
A vs. B, adjusted mean change score (SD) from baseline VAS, current pain (0-10) Baseline: 4.598 (2.395) vs. 4.884 (2.351) Postintervention: −0.490 (–1.132 to 0.152) vs. −1.025 (–1.669 to – 0.381); adjusted difference in change scores 0.535 (95% CI −0.373 to 1.442) Intermediate term: A 0.217 (–0.435 to 0.870) vs. – 0.408 (–1.056 to 0.241); adjusted difference in change scores 0.625 (95% CI −0.294 to 1.544) Long term: 0.573 (–0.079 to 1.225) vs. −0.315 (–0.971 to 0.341); adjusted difference in change scores 0.888 (95% CI −0.036 to 1.813) VAS, main (activity) complaints (0-10) Baseline: 7.244 (1.703) vs. 7.471 (1.619) Postintervention: −1.748 (–2.418 to −1.078) vs. −1.574 (–2.251 to – 0.898); adjusted difference in change scores −0.174 (95% CI −1.123 to 0.775) Intermediate term: −1.285 (–1.962 to −0.608) vs. −1.767 (–2.444 to – 1.090); adjusted difference in changes scores 0.482 (95% CI −0.474 to 1.438) Long term: −1.195 (–1.874 to – 0.515) vs. −2.019 (–2.705 vs. – 1.332); adjusted difference in change scores 0.824 (95% CI – 0.140 to 1.788) MPQ Pain Rating Index Total score (PRI-T) (scale NR) Baseline: 18.08 (9.04) 17.86 (9.94) Postintervention: −1.45 (–4.10 to 1.19) vs. −3.52 (–6.22 to −0.82); adjusted difference in change scores 2.06 (95% CI −1.55 to 5.68) Intermediate term: −1.15 (–3.84 to 1.53) vs. −2.21 (–4.91 to 0.50); adjusted difference in change scores 1.05 (95% CI −2.60 to 4.71) Long term: 0.94 (–1.74 to 3.63) vs. −1.84 (–4.60 to 0.91); adjusted difference in change scores 2.79 (95% CI −0.91 to 6.48) RMDQ (0-23) Baseline (mean, SD): 13.51 (3.92) vs. 13.74 (3.65) Postintervention:–2.47 (–3.86 to – 1.25) vs. −3.04 (–4.29 to −1.79); adjusted difference in change scores 0.58 (95% CI −1.08 to 2.24) Intermediate term: −2.54 (–3.76 to – 1.31) vs. −3.65 (–4.90 to −2.40); adjusted difference in change scores 1.11 (95% CI −0.56 to 2.79) Long term: −2.12 (–3.36 to −0.89) vs. −3.74 (–5.01 vs. −2.48); adjusted difference in change scores 1.62 (95% CI −0.06 to 3.31) |
A vs. B, adjusted mean change (SD) from baseline BDI (0-63) Baseline: 9.75 (6.68) vs. 10.45 (7.06) Postintervention: −0.69 (–2.09 to 0.71) vs. −2.31 (–3.72 to −0.91); adjusted difference in change scores 1.62 (95% CI −0.36 to 3.61) Intermediate term: −2.14 (–3.57 to – 0.71) vs. −2.41 (–3.81 to −1.00); adjusted difference in change scores 0.26 (95% CI −1.74 to 2.27) Long term: −2.17 (–3.60 to −0.75) vs. −2.08 (–3.52 to −0.65); adjusted difference in change scores −0.09 (95% CI −2.11 to 1.93) Global Improvement (1-7) Postintervention: 4.53 (4.13 to 4.93) vs. 4.71 (4.30 to 5.11); adjusted difference in change scores −0.18 (95% CI −0.73 to 0.37) Intermediate term: 4.00 (3.60 to 4.40) vs. 4.76 (4.36 to 5.17); adjusted difference in change scores −0.76 (95% CI −1.31 to −0.21) Long term: 3.89 (3.49 to 4.29) vs. 4.54 (4.13 to 4.95); adjusted difference in change scores −0.65 (95% CI −1.21 to −0.10) |
A vs. B, % (n/N) or mean (SD) Harms
(effect modification by RDQ)
|
|
Turner, 1990 USA Duration of pain: 155 months Poor |
A. Comprehensive pain management program (n=18): 8 weeks (4 hours/week, 32 hours total), low intensity, Individual and group, Outpatient B. Psychological Therapy alone (n=18): 8 weeks (2 hours/week, 16 hours total), low intensity, Individual and group, outpatient |
Mean age: 44 years Male: 52.1% Race/ethnicity: White 100% Pain etiology/type: Chronic LBP (≥6 months) Disability: N/A Comorbidities: NR |
A vs. B, Mean (SD) MPQ Pain Rating Index (0-78) Baseline: 25.54 (12.41) vs. 20.96 (9.95) Postintervention: 14.78 (11.44) vs. 17.71 (12.08) Intermediate term: 13.29 (9.15) vs. 19.50 (15.72) Long term: 18.21 (13.31) vs. 16.41 (13.63) SIP (0-100) Baseline: 8.50 (4.59) vs. 7.90 (6.43) Postintervention: 3.63 (2.98) vs. 4.72 (4.12) Intermediate term: 4.51 (4.68) vs. 7.60 (9.86) Long term: 4.75 (3.40) vs. 5.25 (6.72) |
A vs. B, Mean (SD) CES-D (0-60) Baseline: 12.38 (7.31) vs. 10.40 (7.51) Postintervention: 7.36 (5.89) v vs. 8.08 (4.95) Intermediate term: 8.29 (7.94) vs. 11.36 (8.30) Long term: 10.00 (7.57) vs. 8.29 (7.74) Patient satisfaction (1-7) Postintervention: 5.50 (NR) vs. 4.00 (NR), p<0.05 |
A vs. B, Mean (SD) Harms: NR Patient satisfaction (1-7) Postintervention: 5.50 (NR) vs. 4.00 (NR), p<0.05 |
|
Turner-Stokes, 2003 UK Pain duration: 105.6 months Poor |
A. Comprehensive pain management program (73): 8 weeks (2 full afternoons per week, ~72 hours total), low intensity, group, Outpatient pain management clinics B. Psychological Therapy alone (n=53): 8 weeks (1 hour every other week, 4 hours total), low intensity, group, outpatient |
Mean age: 47 years Male: 31% Race/ethnicity: NR Pain etiology/type: Chronic pain Disability: NR Comorbidities: NR |
Mean difference (95% CI) WHYMPI Pain Severity (0-6) Baseline: adjusted difference −0.24 (95% CI −0.66 to 0.15), p=0.26 Postintervention: adjusted −0.07 (95% CI −0.50 to 0.35) Intermediate term: adjusted difference −0.17 (95% CI −0.59 to 0.24) WHYMPI Pain Interference subscale (0-6) Baseline: adjusted difference −0.23 (95% CI −0.65 to 0.19) Postintervention: adjusted −0.07 (95% CI −0.44 to 0.30) Intermediate term: adjusted difference −0.28 (95% CI −0.69 to 0.13) WHYMPI General Activities subscale (0-6) Baseline: adjusted difference 0.22 (95% CI, −0.15 to 0.59) Postintervention: adjusted difference −0.17 (95% CI −0.47 to 0.13) Intermediate term: adjusted difference −0.11 (95% CI −0.44 to 0.21) |
Mean difference (95% CI) BDI (0-63) Baseline: adjusted difference −1.12 (95% CI −4.43 to 2.41) Postintervention: adjusted difference 0.91 (95% CI −1.89 to 3.71) Intermediate term: adjusted difference −2.19 (95% CI −4.69 to 0.32) STAI (20-80) Baseline: adjusted difference 2.25 (95% CI −2.36 to 6.88) Postintervention: adjusted difference −2.3 (95% CI −6.21 to 1.59), p=0.24 Intermediate term adjusted difference −3.43 (95% CI −7.81 to 0.94) WHYMPI Control over Pain subscale (0-6) Baseline: adjusted difference 0.46 (95% CI −0.04 to 0.97) Postintervention: adjusted difference −0.15 (95% CI −0.59 to 0.29) Intermediate term: adjusted difference 0.16 (95% CI −0.27 to 0.59) | NR |
BDI = Beck Depression Inventory; CES-D = Center for Epidemiological Studies Depression; CI = confidence interval; HADS = Hospital Anxiety and Depression Scale; HRQOL = health-related quality of life; LBP = low back pain; MANCOVA = Multivariate analysis of covariance; MPQ = McGill Pain Questionnaire; NR = not reported; PDI = Pain Disability Index; RCT = randomized controlled trial; RMDQ = Roland Morris Disability Questionnaire; SF-36 = Short-form 36 questionnaire; SIP = Sickness Impact Profile; STAI = State-Trait Anxiety Inventory; SD = standard deviation; SF-36 = Short-Form 36 questionnaire; UK = United Kingdom; VAS = visual analog scale; WHYMPI = West Haven-Yale Multidimensional Pain Inventory.
Table B-10Summary results for trials addressing KQ2: IPMPs
|
Author, Year Country Pain Duration Study Design Study Quality |
Intervention (n) Comparator (n) Duration/Intensity Session Format Setting | Population |
Primary Outcomes: Pain, Function, and Opioid Use |
Secondary Outcomes: HRQOL, Psychological Measures, Global Improvement |
Harms Utilization Patient Satisfaction |
|---|---|---|---|---|---|
|
Allen, 2017 USA Mean duration of symptoms: 124.8 months Cluster RCT Fair |
A. Patient focused multidisciplinary treatment + provider focused multidisciplinary treatment + usual care (n=140 patients, 5 providers): 12 months (time duration NR), individual, community–based outpatient clinics B. Provider focused multidisciplinary treatment + usual care (n=140 patients, 5 providers): 12 months C. Patient focused multidisciplinary treatment + usual care (n=128 patients, 5 providers): 12 months |
Patient Participants Mean age: 63.1 years Male: 25% Non-White race: 41% Joints with OA:
Fair or poor health: 20% Mean BMI: 35.6 kg/m2 Clinic and Provider Characteristics Mean providers: 7.3 Mean medical physicians and osteopaths: 6.2 Mean nurse practitioners and physician assistants: 1.1 Family medicine practice: 60% Internal medicine practice: 40% Providers:
|
Mean change from baseline (SD) (unless otherwise stated) Estimated percentage improving ≥18% on WOMAC score from baseline (8.7-point reduction) a A vs. B Postintervention: 44% (95% CI 35% to 56%) vs. 35% (95% CI 28% to 44%) A vs. C Postintervention: 44% (95% CI 35% to 56%) vs. 49% (95% CI 37% to 63%) B vs. C Postintervention: 35% (95% CI 28% to 44%) vs. 49% (95% CI 37% to 63%) WOMAC Total (0-96) A vs. B Baseline: 40.1 (15.8) vs. 37.7 (17.9) Postintervention change: −6.8 (13.2) vs. −3.7 (13.4), difference in change scores −3.1 (95% CI −5.6 to 0.4) A vs. C Baseline: 40.1 (15.8) vs. 41.0 (15.9) Postintervention change: −6.8 (13.2) vs. −7.7 (13.1), difference in change scores 0.90 (95% CI −2.8 to 4.7) B vs. C Baseline: 37.7 (17.9) vs. 41.0 (15.9) Postintervention change: −3.7 (13.4) vs. −7.7 (13.1), difference in change scores 4.0 (95% CI 0.46 to 7.5) WOMAC Pain (0-20) A vs. B Baseline: 8.4 (NR) vs. 8.0 (NR) Postintervention change: −1.4 (3.6) vs. −0.8 (3.7), difference in change scores −0.6 (95% CI – 1.6 to −0.4) [on 0–10 scale, −0.3 (95% CI −0.8 to −0.2)] A vs. C Baseline: 8.4 (NR) vs. 8.8 (NR) Postintervention change: −1.4 (3.6) vs. −1.5 (3.5), difference in change scores 0.10 (95% CI −0.9 to 1.1) [0–10 scale −0.05, 95%CI −0.45 to 0.55] B vs. C Baseline: 8.0 (NR) vs. 8.8 (NR) Postintervention change: −0.8 (3.7) vs. −1.5 (3.5), difference in change scores 0.70 (95% CI – 0.27 to 1.7) WOMAC Function (0-68) A vs. B Baseline: 27.5 (NR) vs. 26.0 (NR) Postintervention change: −4.8 (9.3) vs. −2.3 (9.7), difference in change scores −2.5 (95% CI – 5.0 to 0.0) A vs. C Baseline: 27.5 (NR) vs. 28.5 (NR) Postintervention change: −4.8 (9.3) vs. −5.6 (9.3), difference in change scores 0.80 (95% CI – 1.8 to 3.4) B vs. C Baseline: 26.0 (NR) vs. 28.5 (NR) Postintervention change: −2.3 (9.7) vs. −5.6 (9.3), difference in change scores 3.3 (95% CI 0.8 to 5.8) SPPB (Physical Function) (scale NR) A vs. B Baseline: 8.5 (NR) vs. 8.8 (NR) Postintervention change: −0.3 (2.1) vs. −0.5 (2.0), difference in change scores 0.2 (95% CI – 0.4 to 0.7) A vs. C Baseline: 8.5 (NR) vs. 8.3 (NR) Postintervention change: −0.3 (2.1) vs. −0.3 (2.0), difference in change scores 0.0 (95% CI – 0.6 to 0.6) B vs. C Baseline: 8.8 (NR) vs. 8.3 (NR) Postintervention change: −0.5 (2.0) vs. −0.3 (2.0), difference in change scores −0.2 (95% CI – 0.7 to 0.3) |
Mean change from baseline (SD) PHQ-8 (0-24) A vs. B Baseline: 4.9 (NR) vs. 4.5 (NR) Postintervention change: −0.6 (3.1) vs. 0 (3.1), difference in change scores −0.6 (95% CI −1.4 to 0.2) A vs. C Baseline: 4.9 (NR) vs. 4.8 (NR) Postintervention change: −0.6 (3.1) vs. −0.4 (3.0), difference in change scores −0.2 (95% CI −1.1 to 0.7) B vs. C Baseline: 4.5 (NR) vs. 4.8 (NR) Postintervention change: 0 (3.1) vs. −0.4 (3.0), difference in change scores 0.4 (95% CI −0.4 to 1.2) |
% (n/N) Harms No study-related adverse events occurred Self–reported OA treatments initiated during study period A vs. B New pain medication (type not specified: 38.8% (40/103) vs. 33.1% (41/124), RR 1.2 (95% CI 0.83 to 1.7) Joint replacement surgery: 3.6% (5/139) vs. 2.1% (3/143), RR 1.7 (95% CI 0.42 to 7.0) A vs. C New pain medication (type not specified): 38.8% (40/103) vs. 27.8% (27/97), RR 1.4 (95% CI 0.93 to 2.1) Joint replacement surgery: 3.6% (5/139) vs. 3.9% (5/128), RR 0.92 (95% CI 0.27 to 3.1) B vs. C New pain medication (type not specified): 33.1% (41/124) vs. 27.8% (27/97), RR 1.2 (95% CI 0.79 to 1.8) Joint replacement surgery: 2.1% (3/143) vs. 3.9% (5/128), RR 0.54 (95% CI 0.13 to 2.2) |
|
Calner, 2017 Sweden Mean duration of pain: 79 months Fair |
A. Multidisciplinary rehab + web-based intervention (Web-BCPA) (n=60): minimum 1.5 months of 2–3 sessions/week; total duration 12 months (time duration NR), mode of delivery NR, Outpatient healthcare centers B. Multidisciplinary rehab alone (n=49) |
Mean age: 43 years Male: 57% Race/Ethnicity: NR Disability: NR
|
A vs. B, % (n/N) or mean (SD) MCID (improvement) of ≥30% on VAS pain Short term: 22% (11/48) vs. 23% (8/35); RR 1.00 (95% CI 0.45 to 2.23) Long term (12 months): 28% (12/44) vs. 22% (8/36); RR 1.23 (95% CI 0.56 to 2.67) VAS pain (0-10) Baseline: 6.61 (1.67) vs. 6.47 (1.62) Short term: 5.94 (2.14) vs. 5.49 (2.30); adjustedb treatment effect, 0.34 (95% CI −0.41 to 1.09) Long term (12 months): 5.66 (2.07) vs. 5.73 (2.25); adjustedb treatment effect, −0.13 (95% CI −0.91 to 0.66) MCID (improvement) of ≥30% on PDI Short term: 20% (10/48) vs. 24% (8/35); RR 0.91 (95% CI 0.40 to 2.07) Long term (12 months): 31% (14/44) vs. 30% (11/36); RR 1.04 (95% CI 0.54 to 2.01) PDI (0-70) Baseline: 36.9 (11.5) vs. 31.9 (13.5) Short term: 33.0 (15.3) vs. 28.3 (15.1); adjustedb treatment effect, −0.4 (95% CI −5.8 to 5.1) Long term (12 months): 30.8 (16.2) vs. 28.7 (17.1); adjustedb treatment effect, −2.6 (95% CI – 8.2 to 2.9) |
A vs. B, % (n/N) or mean (SD) MCID (improvement) of ≥30% on SF-36 subscales: Physical function: Short term: 31% (15/48) vs. 14% (5/35); RR 2.19 (95% CI 0.88 to 5.45) Long term (12 months): 31% (14/44) vs. 14% (5/36); RR 2.29 (95% CI 0.91 to 5.76) Role physical Short term: 25% (12/48) vs. 29% (10/35); RR 0.88 (95% CI 0.43 to 1.79) Long term (12 months): 29% (13/44) vs. 31% (11/36); RR 0.97 (95% CI 0.49 to 1.89) Bodily pain Short term: 52% (25/48) vs. 49% (17/35); RR 1.07 (95% CI 0.69 to 1.66) Long term (12 months): 48% (21/44) vs. 40% (14/36); RR 1.23 (95% CI 0.73 to 2.05) General health Short term: 32% (15/48) vs. 26% (9/35); RR 1.22 (95% CI 0.60 to 2.45 Long term (12 months): 25% (11/44) vs. 31% (11/36); RR 0.82 (95% CI 0.40 to 1.66) Vitality Short term: 48% (23/48) vs. 37% (13/35); RR 1.29 (95% CI 0.77 to 2.17) Long term (12 months): 46% (20/44) vs. 31% (11/36); RR 1.49 (95% CI 0.83 to 2.68) Social functioning Short term: 38% (18/48) vs. 49% (17/35); RR 0.77 (95% CI 0.47 to 1.27) Long term (12 months): 33% (15/44) vs. 46% (17/36); RR 0.72 (95% CI 0.42 to 1.23) Emotional role Short term: 33% (16/48) vs. 29% (10/35); RR 1.17 (95% CI 0.60 to 2.26) Long term (12 months): 25% (11/44) vs. 20% (7/36); RR 1.29 (95% CI 0.56 to 2.98) Mental health Short term: 17% (8/48) vs. 29% (10/35); RR 0.58 (95% CI 0.26 to 1.33) Long term (12 months): 15% (7/44) vs. 26% (9/36); RR 0.64 (95% CI 0.26 to 1.54) SF-36 (0-100) mean scores Physical function Baseline: 49.8 (22.5) vs. 60.1 (23.5) Short term: 52.1 (24.5) vs. 65.9 (22.2); adjustedb treatment effect 0.8 (95% CI −4.7 to 6.2) Long term (12 months): 52.2 (24.0) vs. 63.5 (25.1); adjustedb treatment effect 3.6 (95% CI −2.6 to 9.8) Role physical Baseline: 9.1 (23.3) vs. 11.4 (24.4) Short term: 20.3 (32.1) vs. 25.7 (39.1); adjustedb treatment effect −2.6 (95% CI −16.4 to 11.2) Long term (12 months): 23.9 (35.3) vs. 25.0 (32.2); adjustedb treatment effect – 0.9 (95% CI −15.0 to 16.7) Bodily pain Baseline: 24.8 (14.2) vs. 26.9 (13.9) Short term: 32.2 (16.9) vs. 35.3 (19.0); adjustedb treatment effect −0.1 (95% CI −6.9 to 6.7) Long term (12 months): 34.0 (15.6) vs. 32.7 (20.5); adjustedb treatment effect 4.8 (95% CI −1.8 to 11.3) General health Baseline: 40.4 (17.9) vs. 44.0 (17.0) Short term: 46.5 (20.1) vs. 48.7 (21.3); adjustedb treatment effect 2.0 (95% CI −3.5 to 7.5) Long term (12 months): 43.4 (19.5) vs. 45.4 (20.9); adjustedb treatment effect 2.4 (95% CI −4.9 to 9.6) Vitality Baseline: 24.6 (17.4) vs. 26.9 (18.5) Short term: 34.3 (19.7) vs. 34.7 (25.1); adjustedb treatment effect 3.0 (95% CI −5.1 to 11.2) Long term (12 months): 36.8 (21.1) vs. 32.1 (23.6); adjustedb treatment effect 8.1 (95% CI −0.6 to 16.9) Social functioning Baseline: 46.8 (24.1) vs. 51.1 (27.3) Short term: 54.2 (24.9) vs. 67.5 (24.3); adjustedb treatment effect −8.9 (95% CI −18.6 to 0.8) Long term (12 months): 59.9 (25.7) vs. 63.2 (27.5); adjustedb treatment effect −0.1 (95% CI −10.8 to 10.5) Emotional role Baseline: 47.9 (45.7) vs. 56.8 (41.7) Short term: 63.2 (44.1) vs. 73.3 (36.9); adjustedb treatment effect −2.6 (95% CI −20.9 to 15.8) Long term (12 months): 69.5 (16.0) vs. 65.7 (42.5); adjustedb treatment effect 3.9 (95% CI −16.4 to 24.3) Mental health Baseline: 59.1 (20.9) 62.0 (19.9) Short term: 67.8 (16.4) vs. 70.4 (18.5); adjustedb treatment effect −2.0 (95% CI −8.8 to 4.8) Long term (12 months): 69.4 (16.0) vs. 66.9 (18.9); adjustedb treatment effect 3.2 (95% CI −3.9 to 10.39) | NR |
BCPA = behavior change programme for activity; BMI = Body mass index; CI = confidence interval; GHQ = General Health Questionnaire; HRQOL = Health-related quality of life; MCID = minimal clinically important difference; MPQ = McGill Pain Questionnaire; NR = not reported; OA = osteoarthritis; PDI = Pain Disability Index; PHQ–8 = Patient Health Questionnaire–8; RCT = randomized controlled trial; RR = risk ratio; SF-12 = Short-Form 12; SF-36 = Short-Form 36 questionnaire; SPPB = Short Physical Performance battery; USA = United States of America; VAS = visual analog scale; WOMAC = Western Ontario and McMaster Universities Osteoarthritis Index
- a
Data calculated by hierarchical linear mixed models and based on author imputation
- b
Linear mixed model was adjusted for sex and interaction between time and group
Table B-11Summary results for trials addressing KQ2: CPMPs
|
Author, Year Country Pain Duration Study Design Study Quality Comparison |
Intervention (n) Comparator (n) Duration/Intensity Session Format Setting | Population |
Primary Outcomes: Pain, Function, and Opioid Use |
Secondary Outcomes: HRQOL, Psychological Measures, Global Improvement |
Harms Utilization Patient Satisfaction |
|---|---|---|---|---|---|
|
Bendix 1995, 1997, 1998a, 1998b (PROJECT B) Denmark Duration of pain: ≥6 months (NOS) Fair Higher vs. Lower Total Program Hours |
A. CPMP – 135 hours (n=46) 3 weeks full time, 39 hours/week + 1 day (6 hours) weekly for 3 (135 hours total), group, outpatient rheumatology clinic B. CPMP – 24 hours (n=43) 6 weeks, 4 hours/week (24 hours total), group, outpatient rheumatology clinic |
Mean age: 42 years % Male: 25% Race/Ethnicity: NR Pain etiology/type: Chronic LBP Disability: 68% (working incapable) Comorbidities: Smoker: 64% Prior back surgery: 16% |
A vs. B median (IQR) VAS back pain (0-10) Baseline: 5.3 (NR) vs. 5.9 (NR) Short term: 2.7 (1.4 to 4.3) vs. 5.6 (3.8 to 7.6), p≤0.001 Long term (12 months): 3.3 (2.1 to 5.6) vs. 6.5 (4.8 to 7.7), p≤0.001 Long term (24 months): 3 (2 to 6) vs. 6 (4 to 8), p≤0.001 Long term (60 months): 4 (NR) vs. 6 (NR), p≤0.001 VAS leg pain (0-10) Baseline: 2.9 (NR) vs. 3.7 (NR) Short term: 0.4 (0 to 2.3) vs. 3.1 (0.5 to 5.9), p=0.01 Long term (12 months): 2.1 (0.2 to 4.13) vs. 4.8 (2.3 to 7.3) p=0.001 Long term (24 months): 2 (0 to 5) vs. 5 (1 to 6), p=0.003 Long term (60 months): 3 (NR) vs. 4 (NR), p=NS Patient subjective disability due to back pain (0-30) Baseline: 15.5 (NR) vs. 15.3 (NR) Short term: 8.5 (5 to 15) vs. 16.1 (11 to 19), p=0.002 Long term (12 months): 8.9 (5 to 13) vs. 16.4 (14 to 19), p<0.001 Long term (24 months): 10 (6 to 14) vs. 17 (9 to 21), p=0.002 Long term (60 months): 8 (NR) vs. 16 (NR), p=0.03 |
A vs. B, median (IQR) Global improvement (1-5) Long term (24 months): 2 (1 to 3) vs. 3 (2 to 3), p=0.003 Long term (60 months): 2 (NR) vs. 3 (NR), p=0.003 |
A vs. B, % (n/N) Harms: NR Proportion of patients hospitalized due to low back pain Long term (60 months): 22% (8/37) vs. 23% (7/31); RR 0.96 (95% CI 0.39 to 2.34) Proportion of patients who underwent back surgery during the study period, % ( Long term (60 months): 5% (2/37) vs. 10% (3/31); RR 0.56 (95% CI 0.10 to 3.13) Proportion of patients taking prescription pain medications (opioids not specified), % (n/N) Baseline: 75% (30/40) vs. 66% (23/35) Long term (24 months): 50% (20/40) vs. 67% (23/34); RR 0.74 (95% CI 0.50 to 1.09) |
|
Rose 1997 (Part 2)a UK Mean duration of pain: 97 months Poor Higher vs. Lower Total Program Hours |
A. CPMP – 60 hours: 10 consecutive workdays, 60 hours total, group, outpatient B. CPMP – 30 hours: 5 consecutive full days, 30 hours total, group, outpatient C. CPMP – 15 hours: 5 consecutive half days, 15 hours total, group, outpatient |
Mean age: 42 years % Male: 41% Race/Ethnicity: NR Pain etiology/type: Chronic LBP and/or referred leg pain Disability or sickness benefit: 64% (completers only) Comorbidities: NR Prior spinal surgery: 13% |
Mean (SDs NR) VAS pain (0-10) A vs. B Baseline: 5.0 vs. 6.0 Postintervention: 5.0 vs. 4.3 Intermediate term: 5.1 vs. 5.2 p=ns for all comparisons A vs. C Baseline: 5.0 vs. 5.3 Postintervention: 5.0 vs. 4.9 Intermediate term: 5.1 vs. 4.3 p=ns for all comparisons RMDQ (0-24) A vs. B Baseline: 10.7 vs. 14.0 Postintervention: 8.4 vs. 9.9 Intermediate term: 9.5 vs. 11.5 p=ns for all comparisons A vs. C Baseline: 10.7 vs. 10.8 Postintervention: 8.4 vs. 8.8 Intermediate term: 9.5 vs. 10.0 p=ns for all comparisons |
Mean (SDs NR) The Modified Zung Depression Inventory (Scale NR) A vs. B Baseline: 25.0 vs. 26.0 Postintervention: 22.0 vs. 21.0 Intermediate term: 21.1 vs. 22.0 p=ns for all comparisons A vs. C Baseline: 25.0 vs. 24.0 Postintervention: 22.0 vs. 21.1 Intermediate term: 21.1 vs. 21.1 p=ns for all comparisons | NR |
|
Saral 2016 Turkey Mean duration of pain 90 months Fair Higher vs. Lower Total Program Hours |
A. CPMP – 75 hours (n=22) 10 weeks, ~75 hours total, group, outpatient B. CPMP – 10 hours (n=22) 2 days, ~10 hours total, group, outpatient |
Mean age: 40 years % Female: 100% Race/ethnicity: NR Pain etiology/type: Fibromyalgia Disability: NR Comorbidities: NR
|
A vs. B, Mean (SD) VAS pain (0 to 10) Baseline: 8.2 (0.9) vs. 7.6 (0.8) Intermediate term: 5.1 (2.4) vs. 5.8 (1.0), difference −0.70 (95% CI – 1.82 to 0.42) FIQ (0-100) Baseline: 71.6 (14.2) vs. 67.7 (12.0) Intermediate term: 53.9 (19.3) vs. 54.5 (14.2), difference −0.03 (95% CI −0.66 to 0.59) |
A vs. B, Mean (SD) Baseline: 32.8 (7.9) vs. 36.5 (8.7) Intermediate term: 39.9 (7.5) vs. 39.6 (8.1), difference 0.30 (95% CI −4.69 to 5.29) Baseline: 30.4 (11.7) vs. 33.2 (8.9) Intermediate term: 40.7 (12.3) vs. 40.2 (10.0), difference 0.50 (95% CI −6.72 to 7.72) BDI (0-63) Baseline: 23.4 (11.0) vs. 20.7 (6.6) Intermediate term: 16.6 (9.6) vs. 15.0 (10.2) , difference 0.16 (95% CI −0.46 to 0.78) | Harms: None reported; occasional mild increases in pain after some exercise sessions in both groups A and B. |
|
Reneman, 2020 The Netherlands Mean duration of pain: NR (>1 year = 74%) Fair Higher vs. Lower Total Program Hours |
A. CPMP – Higher hours (n=81) Intended duration: 12, 16 or 20 weeks (4 weeks/10 contact hours more than Group B) Actual duration: 12 or 16 weeks: 96.3% (78/81) Mean (SD) number of weeks of treatment: 11.7 (4.5) Mean (SD) number of contact hours with providers: 30.7 (11.3) Outpatient, Individual B. CPMP – Lower hours (n=72) Intended duration: 8, 12 or 16 weeks (4 weeks/10 contact hours less than Group A) 8 or 12 weeks: 98.6% (71/72) Mean (SD) number of weeks of treatment: 10.8 (3.9) Mean (SD) number of contact hours with providers: 29.8 (10.4) Outpatient, Individual |
Mean age: 44 years % Male: 53% Race/ethnicity: NR Pain etiology/type: Chronic MSK pain Disability:
|
A vs. B, Mean (SD) Baseline: 5.45 (1.78) vs. 5.44 (1.77) Post-treatment: 6.75 (1.61) vs. 6.76 (1.87), difference −0.01 (95% CI – 0.697 to 0.677) PDI (0-70) Baseline: 36.1 (12.5) vs. 37.9 (14.2) Post-treatment: 25.1 (15.0) vs. 26.6 (17.7), difference −1.5 (95% CI – 7.44 to 4.44) |
EQ5D Index (0-1) Baseline: 0.56 (0.19) vs. 0.54 (0.21) Post-treatment: 0.70 (0.17) vs. 0.70 (0.20), difference 0.00 (95 % CI – 0.073 to 0.073) | Harms: No trial-related adverse events were reported. |
|
Harkapaa, 1989, 1990 Finland Mean duration of pain: 173 months Poor Inpatient vs. Outpatient Setting |
A. CPMP - Inpatient (n=156) 2x/week for 2 months (15 sessions) + 2-week refresher sessions after 1.5 years, group, inpatient B. CPMP - Outpatient (n=150) 2x/week for 2 months (15 sessions) + 8 refresher sessions after 1.5 years, group, outpatient |
Mean age: 45 years % Male: 62% Race/Ethnicity: NR Pain etiology/type: Chronic LBP Disability: NR Comorbidities: NR Other characteristics: |
Pain Index (0-400) Baseline (mean, SD): 184.9 (76.9) vs. 178.6 (81.8) [4.6 (1.9) vs. 4.5 (2.0) on a 0-10 scale] Short term: 128 (NR) vs. 146 (NR) [3.2 (1.3) vs. 3.6 (1.8) on a 0-10 scale] Intermediate term: 158 (NR vs. 160 (NR) [3.9 (NR) vs. 4.0 (NR) on a 0-10 scale] Long term (18 months): 156.5 (NR) vs. 174 (NR) [3.9 (1.6) vs. 4.3 (2.2) on a 0-10 scale] Long term (22 months): 149 (NR) vs. 164 (NR) [3.7 (NR) vs. 4.1 (NR) on a 0-10 scale] Long term (30 months): 161.5 (NR) vs. 168 (NR) [4.0 (1.7) vs. 4.2 (2.1) on a 0-10 scale] LBP Disability Index (0-45) Baseline (mean SD): 16.7 (7.9) vs. 17.6 (7.4) Short term: 13.6 (9.7) vs. 14.7 (7.7) Intermediate term: 15.7 (NR) vs. 16 (NR) Long term (18 months): 15.6 (11.1) vs. 17.1 (9.0) Long term (22 months): 14.5 (NR) vs. 15.65 (NR) Long term (30 months): 15.4 (11.0) vs. 16.55 (8.7) | NR | NR |
|
Peters, 1990, 1992 New Zealand Mean duration of pain: NR (6 to 48 months, 49%; 48 to ≥240 months, 51%) Poor Inpatient vs. Outpatient Setting |
A. CPMP – Inpatient Setting (n=23) 4 weeks, intensity NR, group, inpatient B. CPMP – Outpatient Setting (n=29) 9 weeks, 2 hours/week (18 hours total), outpatient |
Mean age: 44 years % Male: 38% Race/Ethnicity:
Comorbidities: NR
|
Mean (SD) or % (n/N) Proportion of patients demonstrating treatment success (using medication appropriately + active + no pain increase), % (n/N) Long term (mean 12 months)c: 68% (15/22) vs. 61% (11/18), RR 1.12 (95% CI 0.70 to 1.78) VAS pain (0-10) Baseline: 5.12 (2.56) vs. 5.25 (2.46) Postintervention: 3.92 (2.33) vs. 4.25 (2.18), difference −0.33 (95% CI −1.80 to 1.14) Data NR – “mean scores indicate Group A’s scores reflect a trend towards greater reduction of pain intensity, in comparison with Group B” Baseline: 204.31 (75.43) vs. 137.78 (105.49) Postintervention: 122.89 (80.84) vs. 96.00 (77.84), difference 26.89 (95% CI −22.39 to 76.17) Proportion of patients taking an opioid, % (n/N) Baseline: Any opioid: 31.8% (7/22) vs. 33% (6/18), RR 0.95 (95% CI 0.39 to 2.34)
|
Mean (SD) Baseline: 19.18 (9.34) vs. 13.55 (6.03) Postintervention: 12.25 (15.64) vs. 10.73 (6.16), difference 1.52 (95% CI −5.59 to 8.63) General Health Questionnaire Baseline: 15.52 (8.58) vs. 8.67 (7.23) Postintervention: 5.96 (7.11) vs. 5.91 (6.42), difference 0.05 (95% CI −4.09 to 4.19) | NR |
|
Ronzi, 2017 France Mean duration of pain: NR (>5 years: 60%) Poor Inpatient vs. Outpatient Setting |
A. CPMP – Inpatient setting (n=49) 5 weeks, 30 hours/week (150 hours total), combo, inpatient B. CPMP – Outpatient setting (n=56) 5 weeks, 11 hours/week (55 hours total), combo, outpatient |
Median age: 40 years % Male: 59% Race/ethnicity: NR Pain etiology/type: Chronic LBP (≥3 months) Disability: NR Sick leave: “almost all patients on sick leave”; median days in past year: 233 Comorbidities:
|
A vs. B VAS pain (0-10) Baseline (median, IQR): 5.4 (4.5 to 6.5) vs. 5.5 (3.6 to 6.8) Long term (mean, SD): 4.5 (2.5) vs. 3.7 (3.4), difference 0.80 (95% CI – 0.48 to 2.08) DPQ daily activity (%; lower = lower impact of pain on QOL) Baseline (median, IQR): 63.0% (51.0% to 72.0%) vs. 57.0% (48.0% to 66.0%) Long term (mean, SD): 51.0% (38.9%) vs. 39.0% (24.5%); difference 0.36% (95% CI −0.06% to 0.79%) |
A vs. B, Median (IQR) Baseline: 35.7 (29.4 to 39.5) vs. 34.5 (30.7 to 39.2) Long term: 39.1 (33.8 to 50.4) vs. 41.6 (34.2 to 49.9) p=NS for all Baseline: 43.3 (32.1 to 49.8) vs. 43.4 (35.9 to 51.1) Long term: 48.3 (42.1 to 53.4) vs. 46.6 (38.7 to 56.6) p=NS for all HADS (0-100) Baseline: 17.0 (12.0 to 21.0) vs. 14.0 (11.0 to 18.0) Long term: 11.5 (7.5 to 18.0) vs. 12.0 (7.0 to 15.0) p=NS for all DPQ anxiety and depression (%; lower = lower impact of pain on QOL) Baseline: 45.0% (20.0% to 60.0%) vs. 35.0% (25.0% to 45.0%) Long term: 30.0% (5.0% to 45.0%) vs. 25.0% (5.0% to 45.0%) p=NS for all | Harms: None reported |
|
Williams, 1996 UK Mean duration of pain: 94 months Poor Inpatient vs. Outpatient Setting |
A. CPMP – Inpatient setting (n=43) 4 weeks, 4.5 days/week (~144 hours total), group, inpatient B. CPMP – Outpatient setting (n=45) 8 weeks, 3.5 hours/week (28 hours total), group, outpatient |
Mean age: 50 years % Male: 49% Race/ethnicity: white, ~85% Pain etiology/type:
Disability: 60% Opioid use: 65% Excess drug use: 58% ≥1 prior surgery: 40% |
A vs. B, mean (SD) VAS pain intensity (0-10) Baseline: 7.11 (1.90) vs. 6.86 (1.49) Short term: 6.00 (2.17) vs. 6.34 (1.96), difference −0.34 (95% CI −1.65 to 0.67) Long term (12 months): 6.52 (2.11) vs. 7.46 (1.88), difference −0.94 (95% CI −19.5 to 0.07) SIP (0-100) Baseline: 29.53 (12.55) vs. 28.48 (9.49) Short term: 15.81 (11.20) vs. 20.95 (10.29), difference −5.14 (95% CI – 10.41 to 0.13) Long term (12 months): 19.40 (13.05) vs. 20.84 (9.58), difference −0.12 (95% CI −0.63 to 0.38) Proportion of patients not using opioids, % (n/N) Baseline: 47% (18/38) vs. 33% (11/33), RR 1.4 (95% CI 0.79 to 2.56) Short term: 82% (31/38) vs. 57% (19/33), RR 1.42 (95% CI 1.02 to 1.97) Long term (12 months): 63% (24/38) vs. 52% (17/33), RR 1.23 (95% CI 0.81 to 1.85) Proportion of patients taking an opioid dose equivalent to >10 mg morphine per day Baseline: 34.2% (13/38) vs. 48.5% (16/33), RR 0.71 (95% CI 0.40 to 1.24) Short term: 10.5% (4/38) vs. 33.3% (11/33), RR 0.32 (95% CI 0.11 to 0.90) Long term (12 months): 10.5% (4/38) vs.18.2% (6/33), RR 0.58 (95% CI 0.18 to 1.88) Mean opioid dose per day (mg morphine equivalents) Baseline: 30 mg vs. 22 mg Short term: NR Long term (12 months): 22 mg vs.15 mg, p=NS |
A vs. B, mean (SD) BDI (0-63) Baseline: 17.8 (8.0) vs. 16.8 (5.6) Short term: 9.5 (7.8) vs. 12.2 (6.3), difference −2.70 (95% CI −6.20 to 0.80) Long term (12 months): 10.8 (8.9) vs. 14.7 (6.6), difference −3.90 (95% CI −7.79 to 0.172) STAI (20-80) Baseline: 45.1 (10.7) vs. 45.7 (8.2) Short term: 36.8 (13.6) vs. 42.3 (10.6), difference −5.50 (95% CI – 11.53 to 0.53) Long term (12 months):: NR VAS pain distress (0-10) Baseline: 6.64 (2.24) vs. 7.03 (2.10) Short term: 4.16 (2.90) vs. 5.42 (2.75), difference −1.26 (95% CI −2.64 to 0.12) Long term (12 months): 4.57 (2.94) vs. 7.37 (2.27), difference −2.80 (95% CI −4.16 to −1.44) |
A vs. B Harms: NR Subsequent treatments
|
|
Rose 1997 (Part 1)a UK Mean duration of pain 97 months Poor Group vs. Individual Session Format |
A. CPMP – Group format (n=26) Duration and intensity NR, group, outpatient B. CPMP – Individual format (n=24) Duration and intensity NR, individual, outpatient |
Mean age: 42 years % Male: 41% Race/Ethnicity: NR Pain etiology/type: Chronic LBP (and/or referred leg pain) Disability or sickness benefit: 64% (completers only) Comorbidities: NR Prior spinal surgery: 13% Unsuccessful PT: 91% |
VAS-pain Baseline: 6.6 vs. 6.0 Postintervention: 5.8 vs. 4.7 Intermediate term: 6.5 vs. 6.0 p=NS for all RDQ (0-24) Baseline: 15.8 vs. 17.0 Postintervention: 13.3 vs. 11.1 Intermediate term: 13.3 vs. 11.1 p=NS for all |
A vs. B, Mean (SDs NR) The Modified Zung Depression Inventory (scale NR) Baseline: 33.1 vs. 32.0 Postintervention: 27.0 vs. 27.0 Intermediate term: 28.0 vs. 26.1 p=NS for all | NR |
|
Abbasi 2012 Iran Mean duration of pain: 74 months Poor CPMP + additional components vs. standard CPMP |
A. CPMP – Spouse-assisted (n=9) 7 weeks, 2 hours/week (14 hours total), combo (primarily group, individual if needed), outpatient B. CPMP – Conventional, patient-oriented (n=10) 7 weeks, 2 hours/week (14 hours total), combo (primarily group, individual if needed), outpatient |
Mean age: 45 years % Male: 12% Race/Ethnicity: NR Pain etiology/type: Chronic LBP Disability: NR Comorbidities:
|
A vs. B, Mean (SD) VAS pain in last week (0-10) Baseline: 5 (2.7) vs. 4.6 (2) Postintervention: 3 (1.8) vs. 2.6 (2), difference 0.40 (95% CI −1.45 to 2.25) Long term: 2.8 (2.7) vs. 3.7 (2.5), difference −0.90 (95% CI −3.42 to 1.62) RDQ (0-24) Baseline: 11.2 (4.3) vs. 12.1 (5.7) Postintervention: 5.8 (3) vs. 6.2 (4.4), difference −0.40 (95% CI −4.10 to 3.30) Long term: 8.2 (5.4) vs. 8.8 (5.9), difference −0.60 (95% CI −6.01 to 4.90) | NR | NR |
|
Altmaier 1992 US Mean duration of pain: NR Fair CPMP + additional components vs. standard CPMP |
A. CPMP + additional psychological components (n=24) 3 weeks, duration NR, intensity NR, inpatient B. Standard CPMP (n=21) 3 weeks, duration NR, intensity NR, inpatient |
Mean age: 40 % Male: 27% Race/Ethnicity: NR Mean duration of pain: NR Pain etiology/type: Chronic LBP Disability: 100% (inclusion criteria: disabled and not working due to pain for ≥3 to ≤30 months) Comorbidities: NR
|
A vs. B, Mean (SD) MPQ Present Pain Intensity (1-5) Baseline: 2.24 (0.77) vs. 2.52 (0.81) Postintervention: 2.05 (0.74) vs. 2.00 (0.89), difference 0.05 (95% CI −0.46 to 0.56) Intermediate term: 2.33 (0.80) vs. 2.00 (0.95), difference 0.33 (95% CI −0.22 to 0.88) MPQ Pain Rating Index (0-78) Baseline: 22.00 (10.41) vs. 17.81 (9.06) Postintervention: 21.71 (9.16) vs. 16.05 (9.31), difference 5.66 (95% CI −0.10 to 11.42) Intermediate term: 20.33 (11.91) vs. 16.19 (12.48), difference 4.14 (95% CI −3.47 to 11.75) WHYMPI Pain Interference Subscale (scale NR) Baseline: 65.38 (13.23) vs. 65.10 (17.10) Postintervention: 57.33 (15.06) vs. 57.67 (16.37), difference −0.34 (95% CI −10.2 to 9.47) Intermediate term: 52.19 (19.58) vs. 50.71 (25.95), difference 1.48 (95% CI −12.86 to 15.82) Low Back Pain Rating Scale Total Score (scale 0-130) Baseline: 57.00 (9.89) vs. 60.19 (14.03) Postintervention: 67.05 (11.01) vs. 71.19 (9.92), difference −4.14 (95% CI −10.68 to 2.39) Intermediate term: 64.86 (12.56) vs. 70.76 (15.70), difference −5.90 (95% CI −14.77 to 2.97) |
A vs. B, Mean (SD) WHYMPI Negative Mood Subscale (scale NR) Baseline: 17.24 (6.68) vs. 17.05 (6.72) Postintervention: 14.19 (5.61) vs. 14.00 (5.92), difference 0.19 (95% CI −3.41 to 3.79) Intermediate term: 16.24 (4.22) vs. 15.00 (6.15), difference 1.24 (95% CI −2.05 to 4.53) | NR |
|
Van der Maas 2015 The Netherlands Mean duration of pain: NR (≥2 years: 75%) Fair CPMP + additional components vs. standard CPMP |
A. CPMP + Psychomotor Therapy (n=49) 3 days a week for 12 weeks, 104 hours total, group, outpatient B. Standard CPMP (n=45) 3 days a week for 12 weeks, 94 hours total, group, outpatient |
Mean age: 42 years % Male: 14% Race/ethnicity: NR Pain etiology/type: Chronic MSK pain (≥3 months) Disability: NR Comorbidities: NR
|
PDI disability (0-70) Baseline: 40.00 (8) vs. 40.34 (11) Postintervention: 33.26 (7) vs. 36.63 (11), difference −3.37 (95% CI −7.12 to 0.38) Short term: 31.33 (11) vs. 35.46 (12), difference −4.13 (95% CI −8.84 to 0.58) Intermediate term: 31.82 (12) vs. 33.71 (14), difference −1.89 (95% CI −7.22 to 3.44) Long term: 32.10 (12) vs. 32.40 (15), difference −0.30 (95% CI – 5.84 to 5.24) |
A vs. B, Mean (SD) RAND-36 physical component (0-100) Baseline: 32.42 (7) vs. 31.51 (7) Postintervention: 34.83 (8) vs. 32.62 (9), difference 2.21 (95% CI – 1.27 to 5.69) Short term: 36.86 (8) vs. 34.36 (9), difference 2.50 (95% CI −0.98 to 5.98) Intermediate term: 35.82 (8) vs. 32.17 (9), difference 3.65 (95% CI – 0.04 to 7.34) Long term: 36.99 (7) vs. 33.90 (7), difference 3.09 (95% CI 0.22 to 5.96) RAND-36 mental component (0-100) Baseline: 39.89 (10) vs. 39.59 (11) Postintervention: 43.45 (11) vs. 39.90 (12) Short term: 42.33 (11) vs. 39.84 (10), difference 2.49 (95% CI −1.83 to 6.81) Intermediate term: 45.59 (10) vs. 45.03 (10), difference 0.56 (95% CI −3.54 to 4.66) Long term: 43.60 (11) vs. 44.59 (9), difference −0.99 (95% CI −5.13 to 3.15) BDI (0-63) Baseline: 20.23 (8) vs. 18.68 (4) Postintervention: 12.81 (8) vs. 15.92 (9), difference −3.11 (95% CI −6.59 to 0.37) Short term: 12.72 (6) vs. 15.33 (10), difference −2.61 (95% CI −5.96 to 0.74) Intermediate term: 13.11 (8) vs. 13.76 (9), difference −0.65 (95% CI −4.13 to 2.83) Long term: 13.32 (8) vs. 13.56 (9), difference −0.24 (95% CI −3.72 to 3.24) | NR |
|
Kool, 2005, 2007 Switzerland Mean duration of pain: NR (“nonacute”) Fair Different philosophical approaches to CPMP |
A. CPMP - Function-Centered (n=87) 3 weeks, 6 days/week (24 hours/week, 72 hours total), individual inpatient B. CPMP - Pain-Centered (n=87) 3 weeks, 6 days/week (15 hours/week, 45 hours total), individual, inpatient |
Mean age: 42 years % Male: 79% Race/Ethnicity: NR Pain etiology/type: Disability: NRComorbidities: NR Other characteristics:
|
A vs. B, mean difference (95%) in change scores from baseline Pain NRS (0-10) Baseline (mean, SD): 5.5 (2.0) vs. 5.7 (2.2) Postintervention: difference in change scores −0.80 (–1.40 to −0.20) Short term: difference in change scores −0.54 (–1.35 to 0.27) PACT (0-200) Baseline (mean, SD): 110 (39) vs. 102 (42) Postintervention: difference in change scores −13.30 (–20.32 to – 6.28) |
A vs. B, Mean (SD) Global improvement (7-point Likert scale) Postintervention: 4.4 (2.0) vs. 3.6 (2.0), difference 0.80 (95% CI 0.19 to 1.40) Short term: no difference between groups (data NR) |
A vs. B, Mean (SD) Harms: NR Patient satisfaction with treatment, median (IQR) Long term (12 months): 6 (4 to 7) vs. 6 (4 to 7) |
|
Leeuw, 2008 The Netherlands Mean duration of pain: 108 months Fair Different philosophical approaches to CPMP |
A. CPMP - “Exposure in vivo” (n=42) 8 weeks (2 hours/week, 16 hours total), individual, outpatient B. CPMP - graded activity (n=43) 13 weeks (2 hours/week, 26 hours total), individual, outpatient |
Mean age: 45 years % Male: 52% Race/Ethnicity: NR Pain etiology/type: Chronic LBP
Other characteristics:
|
A vs. B, mean (SD) or mean (95% CI) change from baseline MPQ (0-100) Baseline: 52.54 (12.77) vs. 54.66 (11.88) Postintervention: 43.72 (21.24) vs. 44.07 (22.86), difference −0.35 (95% CI −10.37 to 9.67) Intermediate term: 41.15 (22.26) vs. 40.45 (22.25), difference 0.70 (95% CI −9.70 to 11.10) Quebec Back Pain Disability Scale (0-100) Baseline: 53.61 (11.63) vs. 51.88 (13.54) Postintervention: 35.90 (20.45) vs. 41.69 (22.58), difference −5.79 (95% CI −15.56 to 3.98) Intermediate term: 39.00 (20.93) vs. 41.94 (19.29), difference −2.94 (95% CI −12.36 to 6.48) Proportion of patients reporting clinically relevant changes on the RMDQ Postintervention: 54% (22/41) vs. 42% (15/36), RR 1.29 (95% CI 0.80 to 2.08) Intermediate term: 50% (19/38) vs. 34% (12/35), RR 1.46 (0.83 to 2.55) RMDQ (0-24) Baseline: 15.23 (3.64) vs. 14.27 (3.44) Postintervention: difference in change scores from baseline −1.95 (95% CI −4.61 to 0.71) Intermediate term: difference in change scores from baseline −2.11 (95% CI −4.76 to 0.54) | NR | Adverse events/harms: - Deterioration during intervention (i.e., treatment counterproductive): 0% (0/42) vs. 2% (1/43)
|
|
Rothman 2013 Sweden Median duration of pain: 18 months Fair CPMP with vs. without pretreatment assessment |
A. CPMP with “multimodal” pretreatment assessment (n=99) Duration NR, Intensity NR, combo, outpatient B. CPMP using standard process (n=108) Duration NR, Intensity NR, combo, outpatient |
Median age (IQR): Treatment: 40 (32 to 47) years, Control: 40 (33-48) years % Male: 23.6% Race/ethnicity: NR Pain etiology/type: Chronic muscular pain Disability: NR Comorbidities : NR |
A vs. B, Median (IQR) VAS pain (0-10) Baseline: 6.95 (5.90 to 8.00) vs. 7.45 (6.00 to 8.10) Long term: 6.0 (3.0 to 8.1) vs. 6.55 (3.80 to 8.00), adjusted OR of improvement from baseline 1.20 (0.63 to 2.30)f ODI (0-100) Baseline: 40 (28 to 50) vs. 38 (28 to 50) Long term: 36 (22 to 49) vs. 38 (28 to 50), adjusted OR of improvement from baseline 1.61 (0.84 to 3.07)f |
A vs. B, Median (IQR) Zung SDS (1-4) Baseline: 3 (2 to 3) vs. 2 (1 to 3) Long term: 2 (2 to 3) vs. 2 (2 to 3), adjusted OR 1.31 (0.69 to 2.47)f Stress and Crisis Inventory (SCI-93) (0-140) Baseline: 60 (45 to 79) vs. 54.5 (33 to 76) Long term: 56 (38 to 75) vs. 51 (33 to 76), adjusted OR 1.10 (0.58 to 2.08)f Baseline: 30 (NR) vs. 30 (NR) Long term: 31 (NR) vs. 30 (NR) Baseline: 35 (NR) vs. 39 (NR) Long term: 40 (NR) vs. 39 (NR) |
Harms: NR Patient Satisfaction (1-7), median (IQR)
|
|
Streibelt 2014 Germany Mean duration of pain: NR Fair CPMP with vs. without pretreatment assessment |
A. CPMP plus pretreatment functional capacity evaluation (FCE) (n=109) 3 weeks, 3 to 4 hours/day (total 50 to 60 hours), individual, inpatient B. CPMP alone (n=113) 3 weeks, 3 to 4 hours/day (total 50 to 60 hours), individual, inpatient |
Mean age: 46 years % Male: 83% Race/ethnicity: NR Pain etiology/type: Chronic MSK disorders
Currently sick-listed: 81% Duration of sick leave last year: 15 weeks Comorbidities: NR
|
A vs. B, mean PDI (0-70) Baseline: 37.4 (14.4) vs. 33.2 (13.6) Long term: 27.0 vs. 33.5, adjusted difference −6.5 (95% CI −12.6 to – 0.4)h | NR | NR |
BDI = Beck Depression Inventory; CI = confidence interval; CPMP = comprehensive pain management program; IQR – interquartile range; LBP = low back pain; MCS = Mental Component Score; MPQ = McGill Pain Questionnaire; MSK = musculoskeletal; NR = not reported; NOS = not otherwise specified; ODI = Oswestry Disability Index; OR = odds ratio; PCS = Physical Component Score; PDI = Pain Disability Index; PT = physical therapy; RCT = randomized controlled trial; RDQ = Roland-Morris Disability Index; RR = risk ratio; SD = standard deviation; SF-36 = Short Form 36 Questionnaire; SIP = Sickness Impact Profile; VAS = visual analog scale; WHYMPI = West Haven-Yale Multidimensional Pain Inventory.
- a
Demographics data include information for patients in both Part 1 and 2 of this study (demographics were not reported separately by the authors).
- b
All followup scores were estimated from graphs in the article. For data included in the meta-analyses, the standard deviation was imputed using average CV of studies under same outcome category. Where means and standard deviations are reported in this table, they came from the results of the meta-analyses.
- c
Range of 9 to 18 months with the majority at 12 months.
- d
Data were estimated by the EPC from figures in the article.
- e
Standard deviations estimated from Figure 2 of article.
- f
Multivariate regression adjusted for sex, age, smoking status, nationality, education level, and relationship status.
- g
- h
Adjusted for baseline score of the outcome, baseline employment status, baseline work ability, baseline PDI and diagnosis.
- Results Overview - Integrated and Comprehensive Pain Management Programs: Effect...Results Overview - Integrated and Comprehensive Pain Management Programs: Effectiveness and Harms
Your browsing activity is empty.
Activity recording is turned off.
See more...