

NCBI Bookshelf. A service of the National Library of Medicine, National Institutes of Health.
National Academies of Sciences, Engineering, and Medicine; Division on Earth and Life Studies; Board on Environmental Studies and Toxicology; Committee on Incorporating 21st Century Science into Risk-Based Evaluations. Using 21st Century Science to Improve Risk-Related Evaluations. Washington (DC): National Academies Press (US); 2017 Jan 5.

This appendix illustrates the use of Bayesian methods to address a common problem in the analysis of high-throughput data that have relatively large measurement error for the purpose of characterizing dose–response relationships. Bayesian methods can be particularly useful for synthesizing data and quantifying uncertainty. To illustrate the utility of Bayesian methods for datasets that have diverse features, the committee provides an analysis that links two types of data that are captured in two distinct datasets. The first dataset contains measurements of dose–response relationships of 969 chemicals on one specific end point related to the activation of the nuclear pregnane X receptor (PXR) pathway. PXR is involved in the sensing of and initiation of metabolism in response to xenobiotics that enter the body and has a role in lipid homeostasis. Activation of the PXR pathway is associated with beneficial and injurious processes, and measurements of the activation of PXR provide information about the biological activity of a chemical. The data on PXR activation were taken from the US Environmental Protection Agency ToxCast Phase II data in the AttaGene test system, which uses a HepG2 human liver hepatoma cell line to measure transcription factor activity through gene expression (Judson et al. 2010a,b). The second dataset contains information about the structures of the tested chemicals. It characterizes each chemical structure according to 39 features, which are the major principal features extracted from 770 chemical descriptors produced by the Mold2 program (Hong et al. 2008). The features describe the structure of each of the 969 chemicals in the dataset. The exercise involves the quantitative structure–activity relationship (QSAR) task of relating chemical structure to a dose–response curve. The information can be used to reduce the uncertainty in the dose–response relationship for PXR activation measured for a chemical and to predict the dose–response relationship for an untested chemical.
The task of relating chemical structures to dose–response curves is challenging because of the large number of potentially relevant chemical features and the lack of prior knowledge relating the features to the dose–response curves for the outcome being studied (PXR activation). Simple statistical QSAR models that do not allow for interactions among the structural features are expected to have poor performance and to underestimate the uncertainty in the prediction. In contrast, more complex statistical approaches, such as flexible Bayesian models, allow relationships between different types of data to be unknown beforehand while borrowing information and allowing learning of lower-dimensional structure. By fitting a single Bayesian hierarchical model to the entire set of chemical-structure descriptors and dose–response curves, the model can adapt the width of the uncertainty bands accordingly and accurately reflect the scope of available information. This full Bayesian approach thus extends the standard QSAR concept of domain of applicability and provides flexible and adaptive measures of uncertainty.
Figure E-1 shows the raw dose–response data for PXR activation by the chemicals under consideration. As expected for so many chemicals that have broadly different chemical structures, the dose–response relationships are highly variable. To predict dose–response values of a new chemical only on the basis of information available on its chemical structure, it is important to predict the dose–response curve with a good appraisal of the uncertainty in the prediction. The accuracy of a prediction depends partly on whether a chemical in the training dataset is similar in structure to the new chemical under consideration.
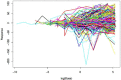
FIGURE E-1
Dose–response records of PXR activation for 969 chemicals represented in the AttaGene ToxCast Phase II data. Dose is presented as concentration (μM) and response as fold increase or decrease in transcription.
To capture nonlinear relationships between dose and response and how the shapes of the relationships are associated with different chemical structures, two assumptions are made: that each dose–response curve is continuous (that is, no “jumps”) and that when two chemicals are structurally alike (defined by a distance metric) their dose–response curves are similar.
Nonparametric Bayesian approaches provide a convenient framework for applying the two assumptions for curve estimation. Specifically, the dose–response curves are allowed to be completely unknown instead of our assuming that the curves follow a particular parametric form, such as a Hill function. That is accomplished by choosing a prior probability distribution for the entire curve. There is a rich literature on such priors; the Gaussian processes (GPs) provide a commonly used choice that is routinely used for many applications. For example, GPs are used routinely in epidemiological studies that collect information on spatial locations to incorporate “random effects” that characterize unmeasured spatially indexed covariates, which might act as confounders.
In the present setting, a GP prior is chosen that allows the dose–response curves to change flexibly according to chemical dose and chemical-structural features. Under the Bayesian nonparametric model used, two response measurements are assumed to be highly correlated a priori when the doses are similar and the chemical structures are similar, and the correlation gradually decays as doses and structural features move farther apart. The GP prior is chosen to allow wide uncertainty in the unknown curves before including information in the database. If one generated samples from the prior, the credible bands (Bayesian versions of confidence bands) would be wide. However, if the prior distribution is updated with information in the full dataset (not just for a single chemical but for all 969 chemicals), a much more accurate estimate of the curve and narrower credible bands are obtained.
Figure E-2 shows, after fitting of the model, the estimated dose–response curve and 95% credible bands for one chemical with the observed PXR dose–response data on that chemical. The figure shows that the estimated curve provides a good fit to the data with narrow uncertainty bands. The estimated curve differs somewhat from that obtained by estimating the dose–response curve non-parametrically on the basis of data only on that chemical (not shown); in particular, the uncertainty bands are narrower, and the curve is shifted slightly from a simple interpolation of the means at each dose. Those properties reflect the borrowing of information on chemicals that have related structures.
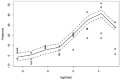
FIGURE E-2
Estimated dose–response curve (solid line) for PXR activation and 95% credible interval (dashed lines) for one chemical. The credible interval is for the mean curve and so is not expected to enclose most of the data points (circles). The estimated (more...)
In addition to improving estimation of the dose–response curve for chemicals on which there are direct dose–response data, the approach can be used to predict dose–response curves for chemicals on which there is information only on structural features. For a chemical that has a known structure but lacks dose–response data, the actual experimental data can be replaced with a model-based statistical prediction. That prediction will be more accurate for chemicals that are structurally similar to chemicals in the database.
To illustrate the performance of the Bayesian modeling, the committee used data on 800 chemicals as training data on which to base the relationships between chemical structure and PXR dose–response relationship by fitting a Bayesian hierarchical model. The committee set aside the structure and PXR dose–response data on the remaining 169 chemicals. To illustrate predictive accuracy, the committee then compared the predicted curves and credible bands with the held-out data.
Figure E-3 shows predicted PXR dose–response relationships for two chemicals drawn from the 169 chemicals that were not used in the development of the Bayesian predictive model. Thus, the data points shown in the figure were not used in predicting the dose–response curve and estimating the uncertainty bands. Note also that the uncertainty bands are wider than those shown in Figure E-2, as expected because the bands in Figure E-2 include direct observations of the dose–response curve, and the dose–response prediction in Figure E-3 bases the estimated relationship only on chemical-structure information. For one chemical, shown first in Figure E-3, there is not a strong observed relationship between chemical dose and PXR activation, and the predicted dose–response relationship accordingly reflects a lack of clear dose-response, at least at lower doses. The dose-response relationship for the second chemical is more defined, as are the direct observations of the dose-response relationship that were not used to create the curve shown. The curve and confidence bands provide a relatively good fit to the observations.
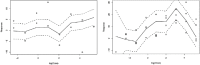
FIGURE E-3
The predicted dose–response curves (solid line) and 95% credible intervals (dashed lines) for PXR activation for two chemicals. Dose is presented as concentration (μM) and response as fold increase or decrease in transcription. The predictions, (more...)
Although Figure E-3 shows only two chemicals for illustration, good performance was observed across the 169 “test” chemicals. In cases in which the estimated dose–response curve had wide uncertainty bands indicating uncertainty in the prediction, the bands were wide enough to contain the curves providing a good fit to the observed data on the chemical.
This example illustrates the utility of Bayesian methods for data integration. Primary advantages are flexibility, the ability to borrow information from different data types, and uncertainty quantification. The committee used a nonparametric Bayesian approach with a GP prior; there is an increasing literature on applying similar approaches in a rich variety of applications, and there are many packages for routinely fitting GP-based models in practice (Vanhatalo et al. 2013). As illustrated in this example, flexible Bayesian hierarchical modeling avoids overly restrictive parametric assumptions that might not be justifiable biologically while allowing incorporation of information from different data sources adaptively. In this context, adaptively means that one learns the similarities in the data sources and how much it makes sense to use the sources as reflected in the uncertainty bands. The increasingly large databases of results for a variety of assays and chemicals can thus be used to inform the current analysis and interpretation and eventually can support the collection of fewer data on future chemicals as the relationships among chemicals and disparate end points are increasingly understood and reflected in good predictive models.
REFERENCES
- Hong H, Xie Q, Ge W, Qian F, Fang H, Shi L, Su Z, Perkins R, Tong W. Mold(2), molecular descriptors from 2D structures for chemoinformatics and toxicoinformatics. J. Chem. Inf. Model. 2008;48(7):1337–1344. [PubMed: 18564836]
- Judson RS, Martin MT, Reif DM, Houck KA, Knudsen TB, Rotroff DM, Xia M, Sakamuru S, Huang R, Shinn P, Austin CP, Kavlock RJ, Dixon DJ. Analysis of eight oil spill dispersants using rapid, in vitro tests for endocrine and other biological activity. Environ. Sci. Technol. 2010a;44(15):5979–5985. [PMC free article: PMC2930403] [PubMed: 20602530]
- Judson RS, Houck KA, Kavlock RJ, Knudsen TB, Martin MT, Mortensen HM, Reif DM, Rotroff DM, Shah I, Richard AM, Dix DJ. In vitro screening of environmental chemicals for targeted testing prioritization: The ToxCast project- Supplemental Information. Environmental Health Perspect. 2010b;118(4):485–492. [November 15, 2016]; http://ehp
.niehs.nih .gov/wp-content/uploads/118/4/ehp .0901392.s001.pdf. [PMC free article: PMC2854724] [PubMed: 20368123] - Vanhatalo J, Riihimäki J, Hartikainen J, Jylänki P, Tolvanen V, Vehtari A. GPstuff: Bayesian modeling with Gaussian processes. J. Mach. Learn. Res. 2013;14:1175–1179.
- A Bayesian Example: Predicting Dose–Response Relationships from High-Throughput ...A Bayesian Example: Predicting Dose–Response Relationships from High-Throughput Data and Chemical Structure - Using 21st Century Science to Improve Risk-Related Evaluations
Your browsing activity is empty.
Activity recording is turned off.
See more...